
Trend & seasonality
Seasonal demand decomposition
Break a weekly retail order series into its underlying growth, annual seasonal shape, promotion effect and residual noise.

This supplied testimonial relates to Rudrriv's broader Data Analysis & Visualization work and is presented with its original service label.
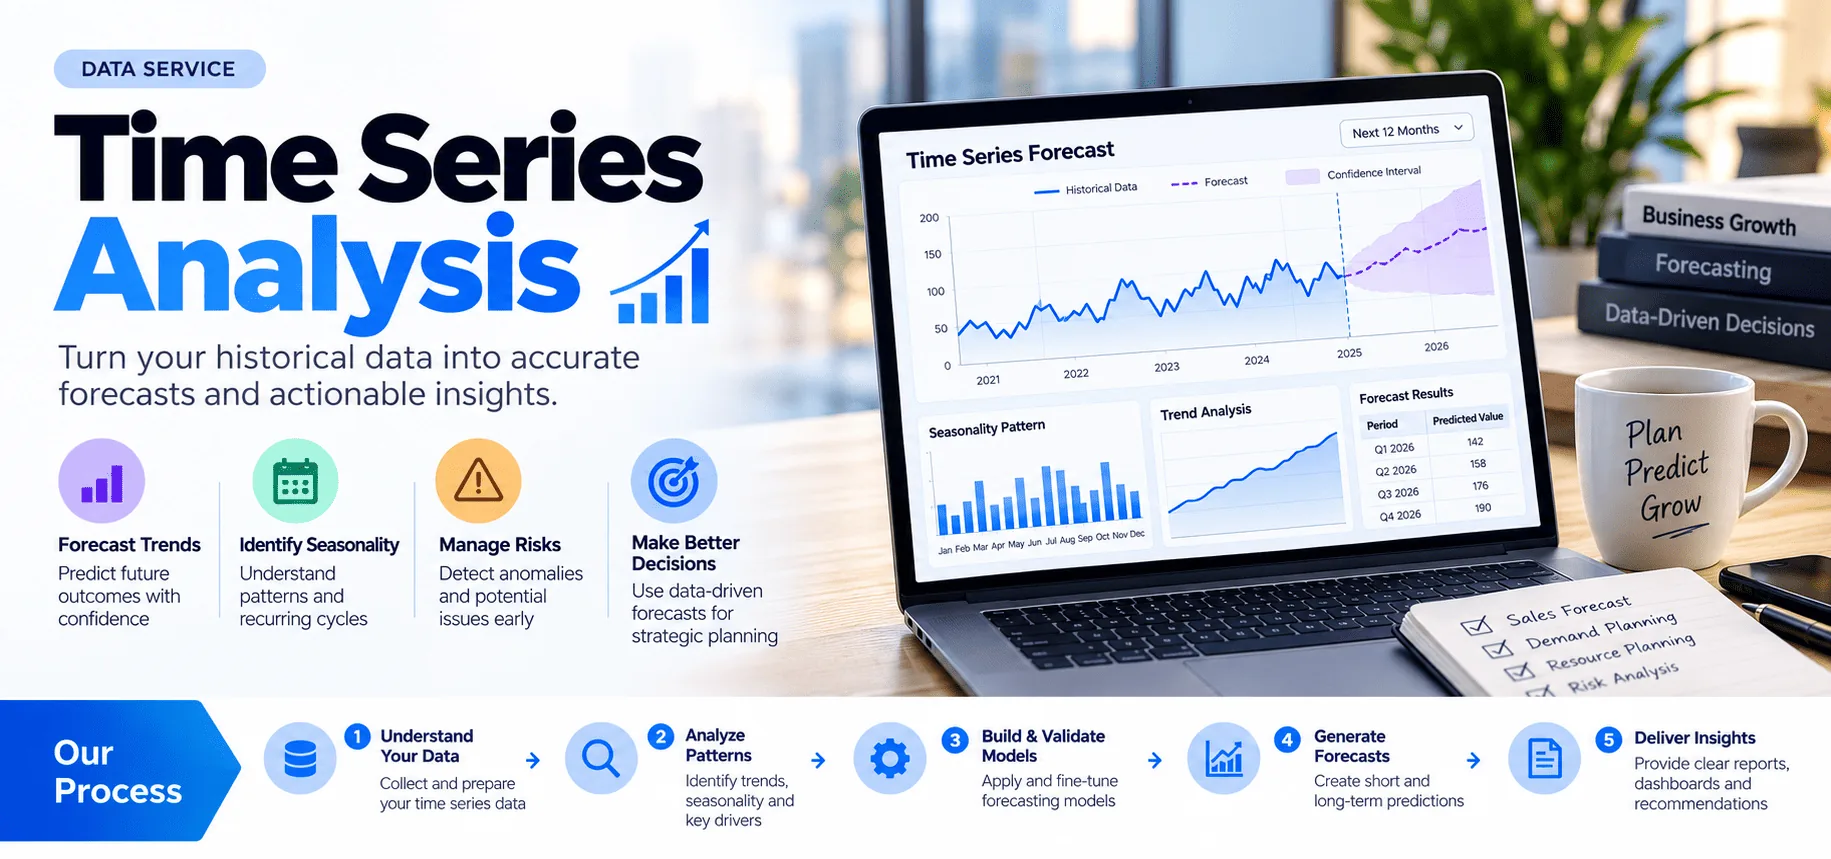
Time series analysis is used when observations are ordered by time: daily sales, weekly demand, monthly revenue, hourly website traffic, sensor readings, financial indicators, service volumes and similar measures. The work goes beyond drawing a trend line. A useful analysis identifies the time structure in the data, tests whether apparent patterns are stable enough to rely on, and separates explanatory findings from forecast assumptions.
Rudrriv provides time series analysis around the decision, data and required forecast horizon you share. The service covers modelling, execution, quality review and delivery of the agreed files and findings.
Share the historical dataset, the date/time field, the measure you want analysed or forecast, the data frequency, the decision the forecast will support, and the forecast horizon you need. If promotions, holidays, prices, campaigns, weather or other drivers may matter, include those fields or explain what is available. Also tell us which output format and software environment your team prefers.
We confirm the target series, time frequency, business question, horizon and required outputs.
Rudrriv reviews data quality, trend, seasonality, breaks, anomalies and usable history.
Appropriate baselines and candidate models are compared using time-aware validation and agreed accuracy measures.
Results, caveats, forecast files, visuals and reusable assets are checked and prepared for handoff.
A forecast is not a guarantee of a future result. The useful deliverable is a transparent model with known assumptions, appropriate validation, an understandable forecast horizon and clear limits. Rudrriv's service is designed to make those decisions reviewable, including what changed in the history, how the model was assessed, and where uncertainty matters.
Choose based on the number of series, validation depth and whether you need reusable modelling code or analysis of external drivers.
| Included | ₹4,999 Essential Time Series Diagnostic Focused analysis and forecasting for one primary business metric. |
₹9,999 Professional Recommended Forecasting Model & Validation For teams that need model comparison, backtesting and reusable analysis assets. |
₹19,999 Advanced Advanced Forecasting Suite For broader, multi-series analysis with external drivers, scenarios and a reusable workflow. |
|---|---|---|---|
| Primary series covered | 1 | Up to 3 | Up to 10 |
| Trend & seasonality analysis | ✓ | ✓ | ✓ |
| Data-quality & anomaly review | ✓ | ✓ | ✓ |
| Forecast model comparison | Baseline + 1 | Up to 3 approaches | Advanced comparison |
| Time-aware backtesting | Basic holdout | ✓ | ✓ |
| Accuracy metrics | Core metric | MAE / RMSE / MAPE as suitable | Expanded diagnostics |
| Forecast intervals | When supported | ✓ | ✓ |
| External-driver evaluation | — | Up to 2 drivers | Included where usable |
| Reusable code / notebook | — | ✓ | ✓ |
| Scenario / sensitivity output | — | — | ✓ |
| Revision rounds | 1 | 2 | 3 |
| Standard delivery | 5 business days | 8 business days | 12 business days |
| Package price | ₹4,999 |
₹9,999 |
₹19,999 |
Five original, detailed examples of what a time-indexed diagnostic, forecast and validation deliverable can look like. Each sample is demonstrative work created with synthetic data, not a claim about a client project.
Break a weekly retail order series into its underlying growth, annual seasonal shape, promotion effect and residual noise.
Illustrate how a 28-day service enquiry forecast can be compared with a daily staffing capacity using 80% and 95% uncertainty bands.
Identify unusual temperature excursions after accounting for expected diurnal behaviour, with residual thresholds and a timestamped event register.
Compare pre- and post-break growth after adjusting for seasonality, distinguishing a one-time level change from a sustained slope change.
Compare seasonal naïve, trend-plus-month, and Holt–Winters forecasts on chronological holdouts before choosing a planning model.
Illustrative sample using synthetic data.
The supplied reviews below are shown with their original Data Analysis & Visualization service label, customer details, rating and timeline. They are not relabelled as Time Series Analysis reviews.
Our priority in Data Analysis & Visualization was reliability. The team designed an end-to-end analysis with a decision-focused visual report with that requirement visible in every stage of the project. They kept a close eye on statistical context, chart selection, visual hierarchy, insight narrative, metric definitions, and segmentation. Progress updates were concise, and the evidence behind important decisions was easy for us to verify. The work ultimately produced a much clearer view of the drivers behind performance and the actions worth prioritizing. We also valued receiving analysis files, reusable charts, source notes, and a concise findings summary, which made the solution much easier to audit and maintain.
The scope for Data Analysis & Visualization looked straightforward at first, but the underlying data issues made it more complex. The team still kept the project focused around an end-to-end analysis with a decision-focused visual report. A lot of value came from the attention to visual hierarchy, insight narrative, metric definitions, segmentation, statistical context, and chart selection. Instead of hiding uncertainty, the team documented it and showed us where additional data or different assumptions would change the result. We came away with a much clearer view of the drivers behind performance and the actions worth prioritizing. The final analysis files, reusable charts, source notes, and a concise findings summary were practical and detailed enough for both review and ongoing operation.
This was our first outsourced Data Analysis & Visualization project, and we needed an end-to-end analysis with a decision-focused visual report with enough documentation for our internal team to take over confidently. The team worked methodically through metric definitions, segmentation, statistical context, chart selection, visual hierarchy, and insight narrative. That made revisions faster because issues were isolated, documented, and resolved rather than repeatedly resurfacing. The work ultimately produced a much clearer view of the drivers behind performance and the actions worth prioritizing. We also valued receiving analysis files, reusable charts, source notes, and a concise findings summary, which made the solution much easier to audit and maintain.
Tell us what you need to understand or forecast, how your data is structured and how the result will be used. Rudrriv will review the scope and respond with the most suitable package or custom approach.