
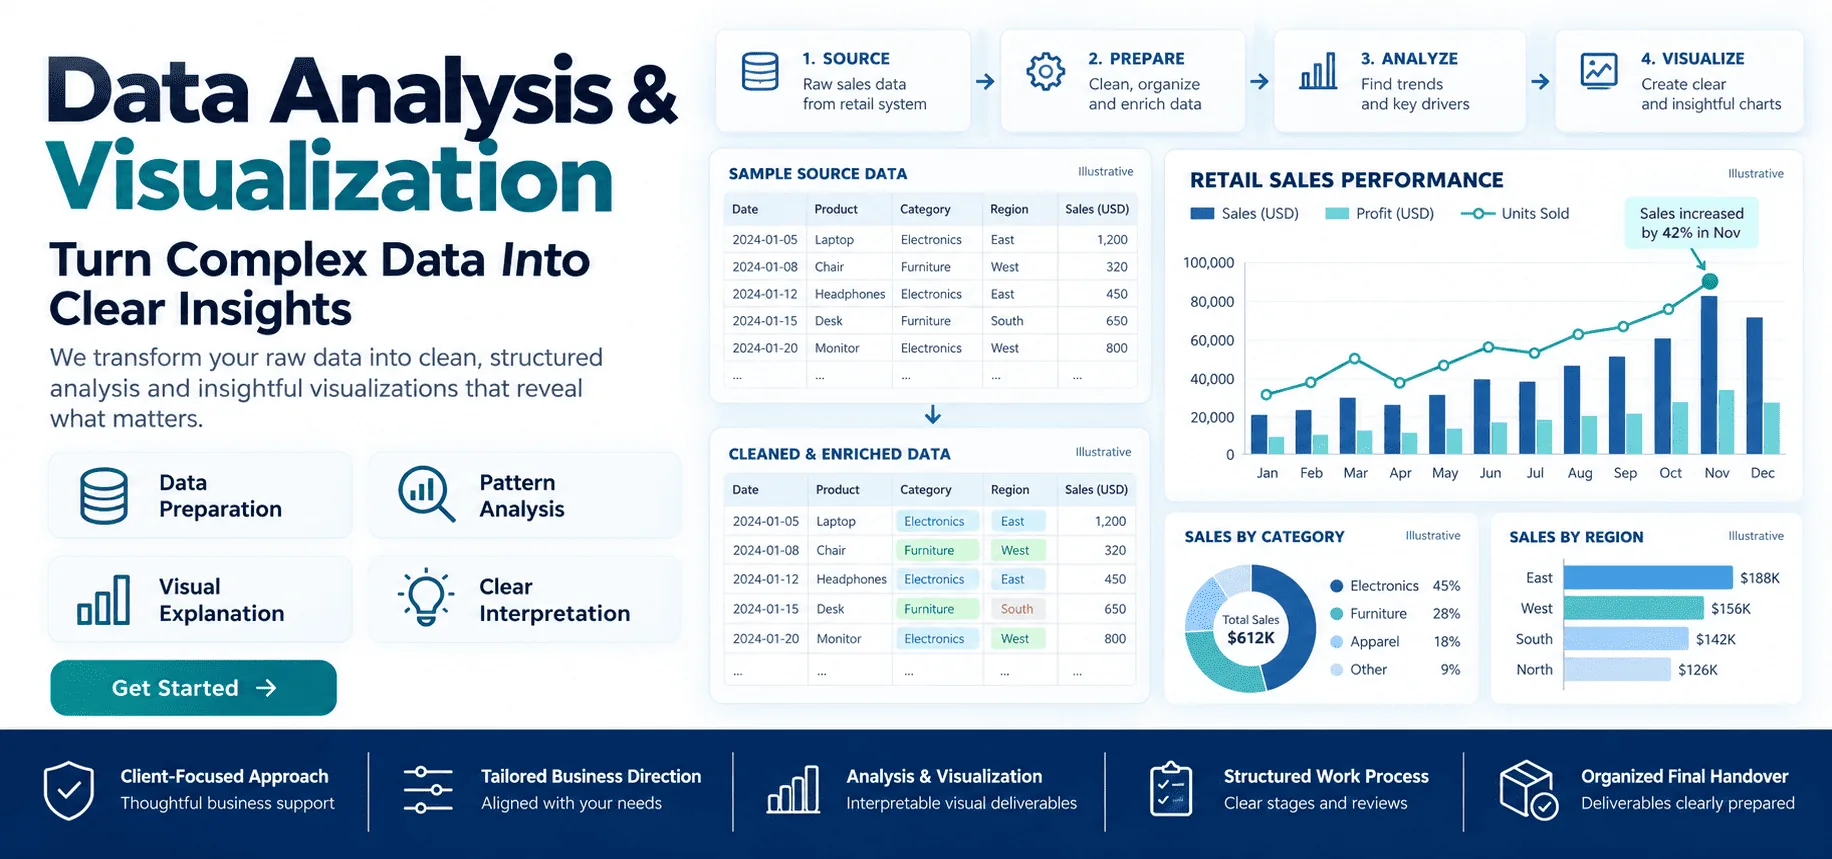
We provide Data Analysis & Visualization for Clearer Business Decisions

Seller
Rudrriv Technologies
★★★★★4.9 (3,657 reviews)
Defined scope and deliverablesQuality-reviewed analysisFrom brief to handover
✓Turn structured business data into reviewed findings, KPI logic and decision-ready visuals with a defined scope, quality checks and final handoff.
✦Service Highlights
  • Analysis covering source review, preparation, KPI logic, interpretation and visual delivery.
  • Suitable for sales, marketing, finance, operations, customer, product and management reporting questions.
  • Outputs can include cleaned data, analysis workbooks, charts, interactive dashboards, findings and metric definitions.
  • Data quality, assumptions, exclusions and calculation logic are made reviewable instead of hidden behind visuals.
  • The service includes scoped analysis, review checkpoints, communication and final handover.

What Clients Appreciate

Read supplied client reviews
H
Harry Collins🇬🇧 United Kingdom★4.9/5
From the initial scoping call, the Data Analytics work was approached as an operational problem to solve, not just a technical exercise. Key details such as data joins, cohort analysis, segmentation, trend interpretation, and quality checks were handled thoughtfully, with enough explanation for both technical and non-technical stakeholders to follow. The final outcome was a reliable set of findings that made our next decisions easier to defend with evidence, supported by clean analysis queries, metric definitions, supporting tables, and documented findings. That combination made the engagement useful immediately and sustainable afterward.
3 months ago · Data Analytics

About This Data Analysis & Visualization Service

From Raw Business Data to Traceable Analysis and Clear Visual Decisions

Data analysis and visualization is the structured process of preparing data, testing its quality, defining the measures that matter, examining patterns and presenting the evidence in a form that decision-makers can use. The work may end in an analysis workbook, a concise findings report, an interactive dashboard or a combination of outputs depending on the question and how your team intends to use the result.

Rudrriv provides the service around a defined requirement. The analysis is completed against the agreed scope, key logic is reviewed, feedback is incorporated and the final files are handed over with the agreed documentation.

What this service can cover
  • Source review and data preparation: field checks, missing-value review, duplicate checks, format standardization and documented exclusions.
  • KPI and metric definition: agreed formulas, filters, groupings and business rules so the numbers can be interpreted consistently.
  • Exploratory and descriptive analysis: distributions, trends, comparisons, exceptions and period-over-period movement.
  • Segmentation and cohort analysis: customer, product, channel, location or time-based groups where the available data supports them.
  • Visualization: decision-focused charts, tables, KPI cards and explanatory callouts selected for the analytical question.
  • Dashboard reporting: interactive Excel or Power BI views when included in the selected package and supported by the data.
  • Findings and handover: concise interpretation, caveats, metric definitions and working files appropriate to the agreed tool.
What we need from you

Share the relevant data source or export, the decision or reporting question you need to answer, any existing KPI definitions, who will use the output, known data-quality issues, your preferred reporting tool or file format, and your deadline. If access to a database or business platform is required, confirm the safest practical access method during scoping rather than placing credentials in the enquiry form.

How the analysis process works
01
Question & scope

Confirm the decision, audience, inputs, outputs and package boundaries.

02
Prepare & validate

Review structure, clean agreed issues, map fields and record assumptions.

03
Analyze

Calculate KPIs and examine trends, segments, cohorts, variances or exceptions.

04
Visualize & review

Build the agreed visual output, verify labels and calculations, then apply feedback.

05
Handover

Deliver the agreed files, metric definitions, findings and usage notes.

Scope boundaries: data analysis can organize and interpret the evidence available in your sources, but it cannot recreate missing history or guarantee a commercial outcome. Real-time engineering, predictive modelling, custom software and large-scale data-platform work should be scoped separately.
Typical inputs
Excel, CSV, Sheets exports,
database or system extracts
Analysis methods
KPIs, trends, variance,
segments, cohorts, exceptions
Possible outputs
Workbook, dashboard,
visual report, findings & notes

Compare Data Analysis & Visualization Packages

Choose Essential for one focused source and a concise visual analysis, Professional when you need multiple compatible sources and an interactive dashboard, or Advanced for a broader multi-source workspace with deeper documentation and handover.

Included
₹5,999
Essential
Analysis Snapshot
Focused analysis for one structured source and one clear reporting question.
₹12,499
Professional Recommended
Business Insight Dashboard
Multi-source preparation, KPI logic and one interactive dashboard view.
₹19,999
Advanced
Analytics Workspace
Broader modelling, deeper analysis, multi-page reporting and documented handover.
Compatible data sources1Up to 3Up to 5
Cleaning & validation✓✓✓
Agreed KPIs / measuresUp to 6Up to 12Up to 20
Trend & variance analysis✓✓✓
Segment / cohort analysisWhen supported✓✓
Interactive dashboard—1 pageUp to 3 pages
Data model / relationships—Basic joins✓
Working / source files✓✓✓
Metric definitionsCoreDetailedMetric dictionary
Findings / insight summary✓✓Executive summary
Handover walkthrough——30 minutes
Revision rounds123
Standard delivery3 days5 days8 days
Package price
₹5,999
₹12,499
₹19,999

Package limits assume reasonably structured, accessible source data. Third-party licences, paid connectors, major data engineering, real-time pipelines, predictive models and custom application development are not included unless separately agreed.

SELECTED ANALYTICAL WORK FIVE CONCEPT STUDIES

Data Analysis & Visualization Portfolio

Explore how raw numbers become traceable business findings: variance, retention, conversion, operational timing and survey evidence. Every example is original concept work using synthetic data—not a real client project or measured outcome.

01 — 05
Retail variance investigation01 / 05

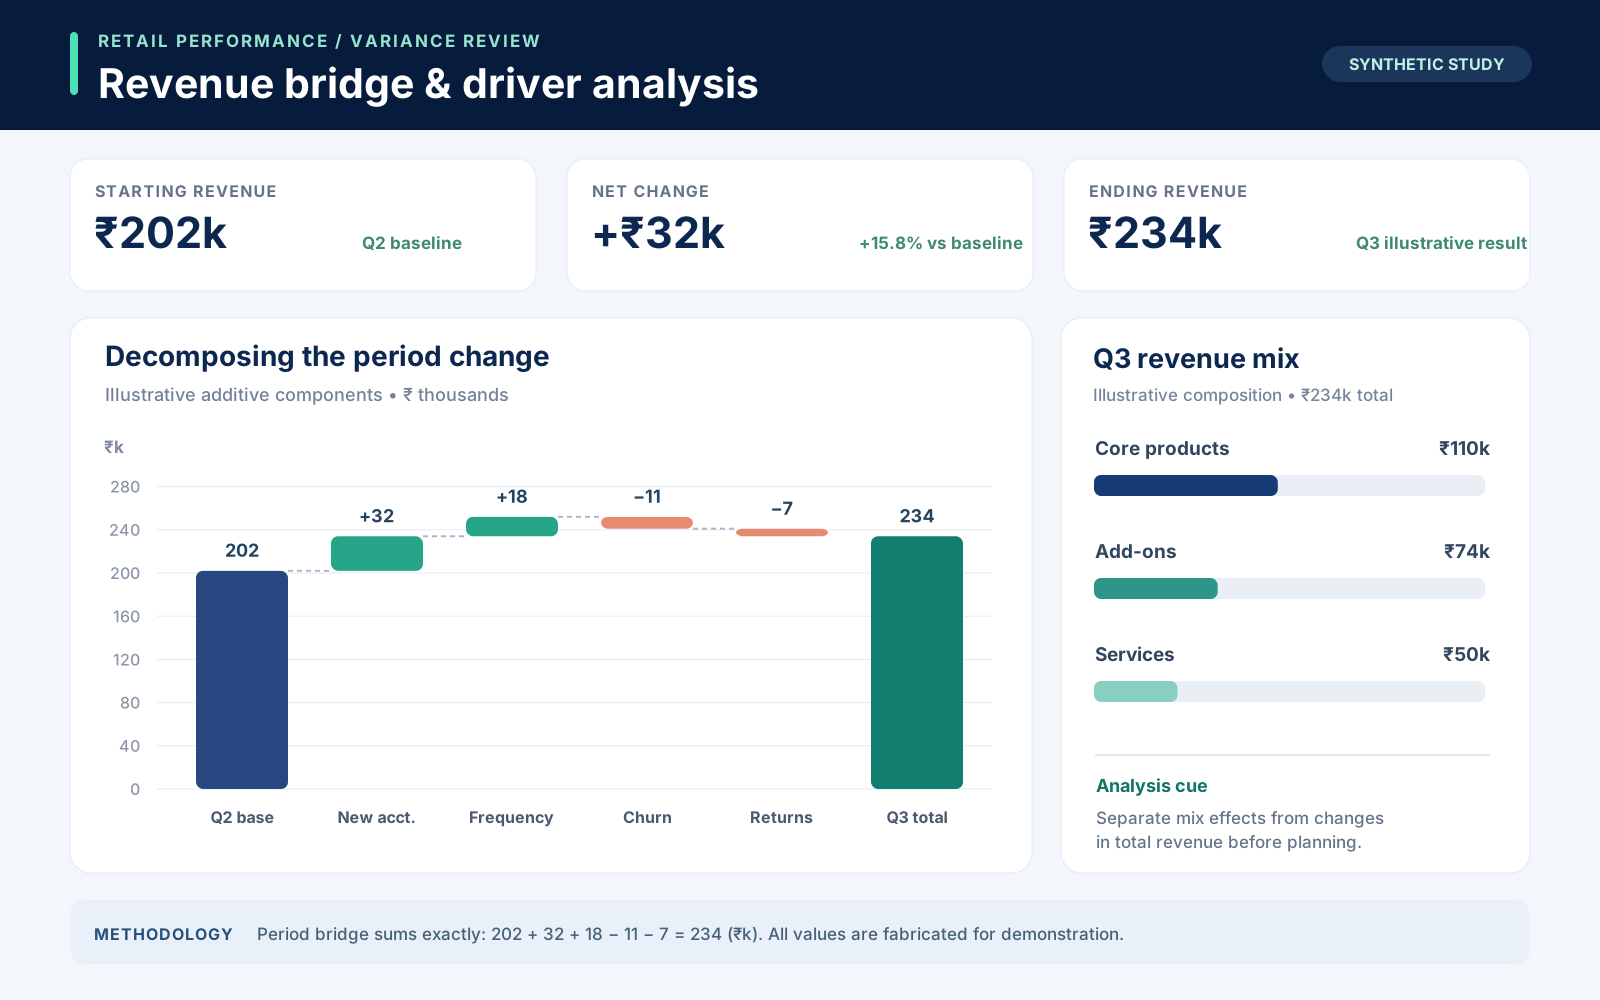
Revenue Bridge & Driver Analysis

A reconciled Q2-to-Q3 revenue bridge with an additive variance breakdown, segment contribution and decision notes.

Variance bridgeKPI definitionsSegment mix
Retention and cohort comparison02 / 05

Customer Retention Cohort Study

An acquisition-month heatmap and retention curves that distinguish observed months from cohorts without enough history.

Cohort heatmapRetention curvesSample context
Marketing funnel exploration03 / 05

Conversion Funnel & Channel Mix

A five-stage conversion audit with reconciled volumes and a comparison of channel traffic share against won share.

Funnel analysisChannel comparisonRate calculations
Service delivery bottleneck analysis04 / 05

Operations Cycle-Time Review

A stage-level elapsed-time decomposition, percentile context and an analytical cue for handoff-delay review.

Process breakdownCycle-time metricsBottleneck insight
Survey findings visualization05 / 05

Customer Satisfaction Study

Four five-point response distributions, clearly defined positive rates and a concise prioritization takeaway.

Likert analysisSurvey breakdownFindings brief

Frequently Asked Questions

Depending on the selected package, the service can include source-data review, cleaning and validation, KPI definition, exploratory analysis, trend or variance analysis, segmentation or cohort views, charts, dashboards, insight summaries and documented handover files.
Structured sources such as Excel workbooks, CSV files, Google Sheets exports, database extracts and exports from business systems can be assessed. The exact approach depends on the data structure, quality, access method and agreed scope.
Yes. Package scope can include duplicate checks, missing-value review, type and format corrections, category standardization, basic reconciliation and documented assumptions so the analysis is built on a clearer working dataset.
Yes, when the sources contain compatible keys, definitions and time coverage. Multi-source work may require mapping, joins, reconciliation and a data model, so it is normally suited to the Professional, Advanced or a custom scope.
The delivery can use tools such as Excel, Power BI, Tableau, Looker Studio, SQL or Python where they fit the requirement. The final toolset is confirmed during scoping and may depend on your existing environment, licences and desired handover format.
Standard package delivery is 3 days for Essential, 5 days for Professional and 8 days for Advanced after complete inputs are received. Poor data quality, access dependencies or custom requirements can change the schedule and are confirmed before work begins.
Please provide the relevant data, the business question or reporting objective, known KPI definitions, the intended audience, any known data-quality issues, your preferred output format, required platform and deadline. Only share data that is necessary for the agreed work.
Yes, the packages include working or source files appropriate to the agreed tool, along with the package-specific findings and metric definitions. Advanced work also includes a broader handover with assumptions and usage notes.
Confidentiality, access and data-handling requirements should be discussed before transfer. Rudrriv requests only the information necessary for the project, and highly sensitive or regulated datasets should be scoped before any files or credentials are shared.
Real-time data pipelines, data-warehouse engineering, predictive or machine-learning models, major API integrations, custom software development and ongoing analytics operations are not assumed in the fixed packages. They can be assessed separately when required.

Client Reviews

The reviews below use the client content supplied for this Data Analytics service page without adding review totals, sales counts or unsupported social-proof statistics.

E
Ella Campbell
🇨🇦 Canada
Data Analytics
★ 4.7 / 5   •   4 months ago

We hired the team for Data Analytics with a clear objective: deliver a structured analytics project covering KPIs, trends, and business segments without creating a solution that was too fragile to maintain. The project stayed controlled because the team treated segmentation, trend interpretation, quality checks, KPI logic, and data joins as core requirements, not optional polish to be added at the end. The delivered solution resulted in a reliable set of findings that made our next decisions easier to defend with evidence. Having clean analysis queries, metric definitions, supporting tables, and documented findings alongside it reduced follow-up questions and made ownership transfer simple.

R
Ruby Walker
🇦🇺 Australia
Data Analytics
★ 5 / 5   •   5 months ago

For this Data Analytics project, we needed a structured analytics project covering KPIs, trends, and business segments that could stand up to real operational use rather than a one-off demonstration. We appreciated the discipline around quality checks, KPI logic, data joins, cohort analysis, and segmentation. The team kept technical detail available when we needed it, while still making review sessions understandable for business stakeholders. By delivery, we had a reliable set of findings that made our next decisions easier to defend with evidence. The accompanying clean analysis queries, metric definitions, supporting tables, and documented findings were well organized and gave our team a solid basis for future updates.

D
Daan Jansen
🇳🇱 Netherlands
Data Analytics
★ 5 / 5   •   3 weeks ago

We chose a specialist for Data Analytics because our requirements called for a structured analytics project covering KPIs, trends, and business segments with measurable quality rather than a generic template. They kept a close eye on data joins, cohort analysis, segmentation, trend interpretation, and quality checks. Progress updates were concise, and the evidence behind important decisions was easy for us to verify. The delivered solution resulted in a reliable set of findings that made our next decisions easier to defend with evidence. Having clean analysis queries, metric definitions, supporting tables, and documented findings alongside it reduced follow-up questions and made ownership transfer simple.

R
Rohan Malhotra
🇮🇳 India
Data Analytics
★ 4.9 / 5   •   1 month ago

Our priority in Data Analytics was reliability. The team designed a structured analytics project covering KPIs, trends, and business segments with that requirement visible in every stage of the project. A lot of value came from the attention to segmentation, trend interpretation, quality checks, KPI logic, and data joins. Instead of hiding uncertainty, the team documented it and showed us where additional data or different assumptions would change the result. By delivery, we had a reliable set of findings that made our next decisions easier to defend with evidence. The accompanying clean analysis queries, metric definitions, supporting tables, and documented findings were well organized and gave our team a solid basis for future updates.

H
Hugo Thomas
🇫🇷 France
Data Analytics
★ 4.8 / 5   •   6 weeks ago

The scope for Data Analytics looked straightforward at first, but the underlying data issues made it more complex. The team still kept the project focused around a structured analytics project covering KPIs, trends, and business segments. The team worked methodically through quality checks, KPI logic, data joins, cohort analysis, and segmentation. That made revisions faster because issues were isolated, documented, and resolved rather than repeatedly resurfacing. The delivered solution resulted in a reliable set of findings that made our next decisions easier to defend with evidence. Having clean analysis queries, metric definitions, supporting tables, and documented findings alongside it reduced follow-up questions and made ownership transfer simple.

O
Olivia Reed
🇺🇸 United States
Data Analytics
★ 5 / 5   •   2 months ago

This was our first outsourced Data Analytics project, and we needed a structured analytics project covering KPIs, trends, and business segments with enough documentation for our internal team to take over confidently. The project stayed controlled because the team treated data joins, cohort analysis, segmentation, trend interpretation, and quality checks as core requirements, not optional polish to be added at the end. By delivery, we had a reliable set of findings that made our next decisions easier to defend with evidence. The accompanying clean analysis queries, metric definitions, supporting tables, and documented findings were well organized and gave our team a solid basis for future updates.

Request a Data Analysis & Visualization Quote

Tell us what data you have, what question or reporting decision you need to support, and what output you expect. Rudrriv will review the brief and recommend the most suitable package or custom scope.
Business questionExplain the decision, problem, KPI or reporting need the analysis should support.
Data sourcesSummarize the files, exports, tables or systems involved and whether sources need to be combined.
KPIs & analysis depthList known metrics, comparisons, segments, cohorts, trends or exceptions that matter.
Output & platformTell us whether you need an analysis workbook, PDF report, charts, Excel dashboard, Power BI dashboard or another agreed format.
Known data issuesMention missing fields, duplicates, conflicting definitions, access restrictions or other limitations already identified.
Deadline & handoverShare the required delivery date, intended audience, confidentiality requirements and whether your team needs working files or a walkthrough.
Helpful to include: source type, approximate volume, business question, KPI definitions, output preference, current tools, deadline and any access constraints. Do not paste passwords, API keys or unnecessary sensitive personal data into the form.
DATA ANALYSIS & VISUALIZATION ENQUIRY

Request a Scope Assessment

Share your contact details and requirement below. Your enquiry will be sent directly to support@rudrriv.com for review.

Please include enough detail for us to assess the analytical scope and delivery timeline. We will use your information only to respond to this enquiry.