
We provide Data Analytics for Clearer Business Decisions

Seller
Rudrriv Technologies
★★★★★4.9 (3,657 reviews)
✓Share your data and decision question. We provide analysis, KPI logic, quality review, revisions and final handoff according to the selected package.
✦Service Highlights
  • Get structured analysis built around a defined business question rather than generic charts.
  • Scope can cover data cleaning, validation, KPI logic, trends, segments, dashboards and insight summaries.
  • Receive reviewable assumptions, metric definitions and editable analytical outputs according to package scope.
  • The service includes analytical workflow, quality checks and final delivery.
  • Fixed packages start at ₹6,000, with custom scoping for larger, sensitive or technically complex analytics work.

What Clients Appreciate

The supplied customer feedback below is specifically labelled Data Visualization. It is presented with that original service label rather than being recast as a Data Analytics review.

Z
Zoe Mitchell🇦🇺 AustraliaData Visualization★ 4.7 / 5
The strongest part of this Data Visualization engagement was how quickly the team turned a loosely defined need into a suite of clear, presentation-ready data visualizations. The work was especially strong around labeling, interaction design, accessibility, story flow, chart choice, and visual hierarchy; each review tied technical decisions back to how the output would be used. The finished work gave us complex results that stakeholders could understand quickly without lengthy explanation, and the delivery of editable visual assets, source mappings, style rules, and reusable layouts made the project easy to transition to our own team.
4 months ago

About This Data Analytics Service

Turn existing business data into a reviewed analytical output your team can use

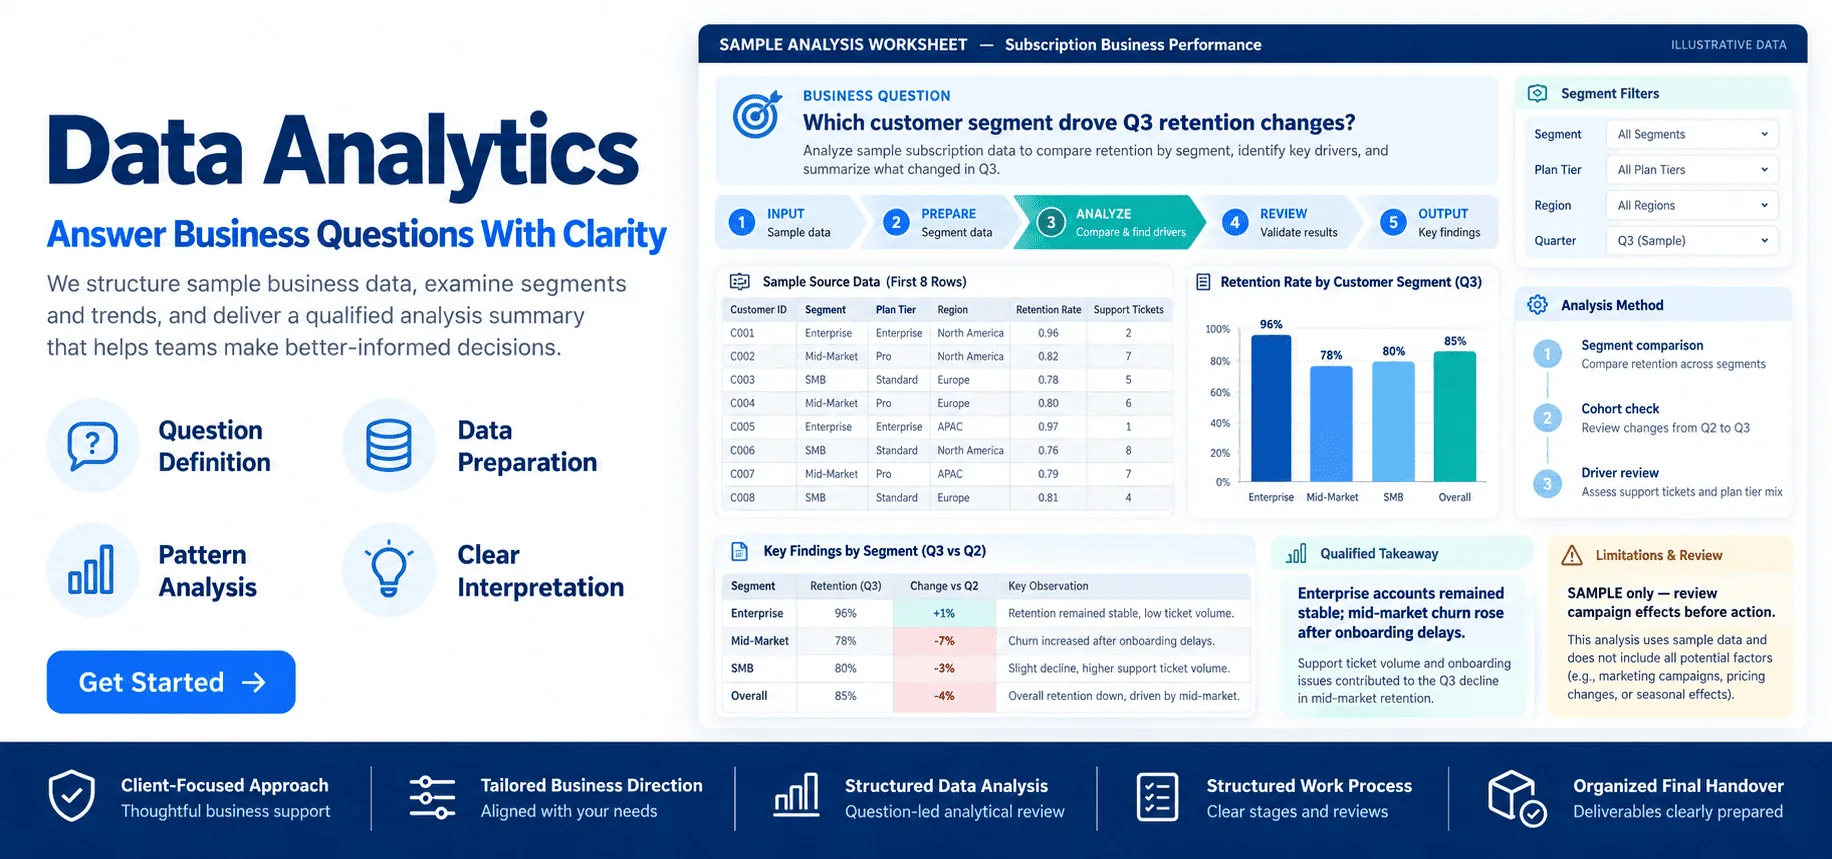
Data Analytics is the structured process of preparing data, defining measures, examining patterns and presenting evidence in a form that supports a business question. Rudrriv’s service is designed for businesses that already have spreadsheets, exports or structured system data and need clearer answers, consistent metrics or reusable reporting.

The work starts with the decision or reporting need—not with a preferred chart. That keeps cleaning, calculations, comparisons and visual outputs tied to the question the analysis is meant to answer. Where the source data cannot support a conclusion, the limitation is documented rather than hidden behind polished visuals.

What this service can include
  • Data intake and structure review: assess fields, grain, date coverage, definitions and known source issues.
  • Cleaning and validation: review duplicates, missing values, inconsistent types, category mapping and obvious integrity problems.
  • Exploratory analysis: examine trends, distributions, comparisons, segments, exceptions and material changes.
  • KPI definition: document formulas, filters, exclusions and reporting interpretation for agreed measures.
  • Business-focused visualization: create charts or dashboard views that answer specific questions rather than adding decorative complexity.
  • Insight summary: separate findings, assumptions, caveats and decision cues so stakeholders can review the evidence.
  • Editable handover: provide the agreed cleaned data, workbook, dashboard or analysis files, plus metric and usage notes where included.
Typical business use cases
  • Sales performance analysis across periods, products, channels, locations or customer groups.
  • Marketing reporting for campaign, source, funnel and conversion performance.
  • Operations analysis covering throughput, backlog, turnaround, exceptions or service-level measures.
  • Management reporting that consolidates recurring KPIs into one defined review view.
  • Customer, cohort or segment analysis where overall averages are hiding meaningful differences.
  • Focused investigation of a variance, unexpected result or specific business question.
What we need from you

Share the source data, the question or decision the analysis should support, any known metric definitions, who will use the output, your preferred format, known data-quality issues, required deadline and any confidentiality or access constraints. Share your data, business question and constraints. Rudrriv uses the brief to define the analysis steps, validation checks and outputs needed for the agreed scope.

How the analytics process works
01
Define the question

Confirm the decision, reporting need, audience, source data, KPI definitions and expected output.

02
Prepare & validate

Review structure, clean agreed issues, map fields and document assumptions before interpreting results.

03
Analyze & review

Calculate agreed measures, explore trends and segments, then quality-check logic, filters and outputs.

04
Explain & hand over

Deliver the agreed files, findings, assumptions, metric definitions and usage or refresh notes.

Scope boundaries that keep the analysis reliable

Analytics can organize and interpret available evidence, but it cannot recreate missing source history, verify facts that are absent from the data or guarantee a commercial outcome. Predictive modelling, machine learning, real-time pipelines, data warehouses, regulated-data environments and complex source-system engineering are assessed separately when they materially change the work.

Typical inputs
Excel / CSV
Google Sheets exports
Database or system extracts
Common outputs
Cleaned data
Analysis workbook
Dashboard / insight report
Common methods
Trend & variance analysis
Segmentation
KPI / diagnostic analysis

Compare Data Analytics Packages

Choose a package by source complexity, KPI depth, reporting format and handover requirements. Large datasets, sensitive environments, production pipelines or predictive work should be scoped separately.

Included
₹6,000
Essential
Decision Snapshot
Focused analysis for one structured dataset and one clear business question.
₹12,500
Professional Recommended
KPI Analysis Pack
Multi-source analysis with defined KPIs and an interactive reporting view.
₹19,000
Advanced
Analytics Decision Suite
Deeper multi-source analysis, data modelling and executive-ready handover.
Structured data sources1Up to 3Up to 5 related
Cleaning & validation✓✓✓
KPIs / measuresUp to 5Up to 10Up to 15
Exploratory analysisFocusedExpandedExpanded + advanced calculations
Trend & segment analysis✓✓✓
Interactive dashboard—1 pageUp to 3 pages
Data model / relationships—As needed for included sources✓
Insight summaryConciseDetailedExecutive report
Editable analysis files✓✓✓
Revision rounds122
Standard delivery3 business days5 business days7 business days
Package price
₹6,000
₹12,500
₹19,000
Package note: Third-party software licences, paid connectors, cloud usage, data acquisition and extensive source-system engineering are not included unless specifically stated in the confirmed scope.

SELECTED ANALYTICAL STUDIES 05 CONCEPT SAMPLES

Data Analytics Work, Through Five Different Questions

A portfolio of illustrative, decision-focused analytics outputs—from quantified drivers to segmented comparisons. All visuals use synthetic example data and represent potential deliverables, not completed client commissions or verified outcomes.

Revenue & margin analytics

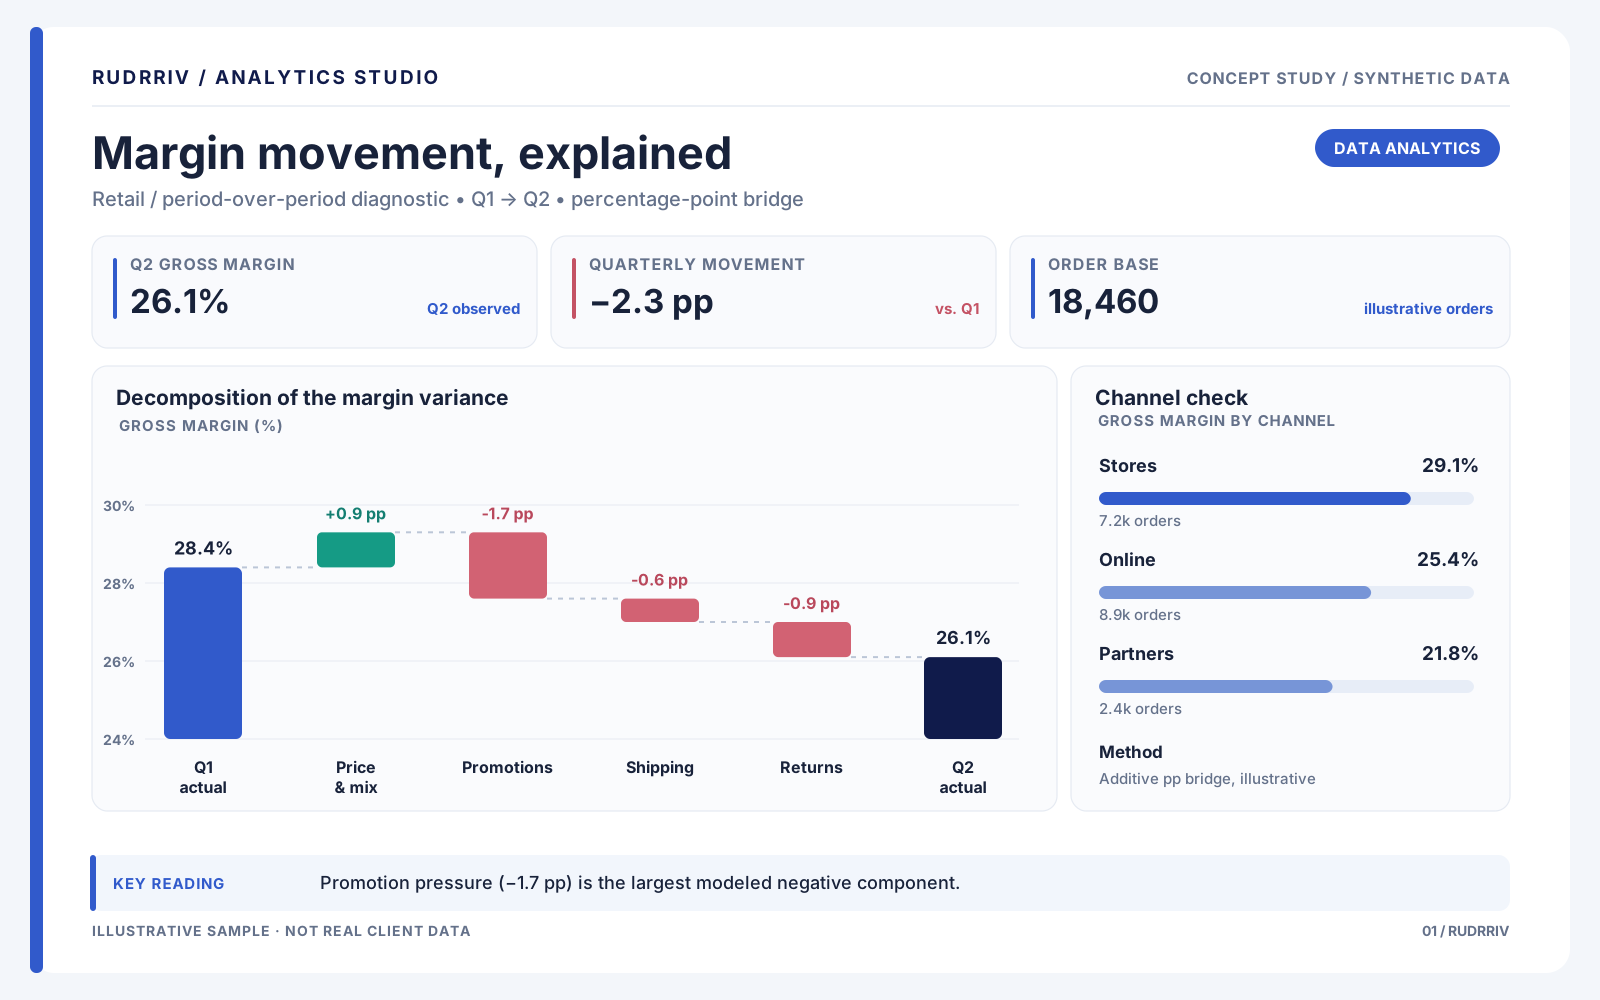
Retail margin variance: a diagnostic bridge

A percentage-point decomposition separates pricing, promotion, shipping and returns effects so a stakeholder can interrogate the reported margin movement.

Variance decompositionChannel segmentsKPI definitions
Customer & cohort analytics

Subscription cohort retention analysis

Monthly join cohorts are aligned at comparable ages; the retention heatmap and mature-cohort comparison reveal patterns hidden by pooled active-user totals.

Cohort methodologyRetention heatmapEqual-age comparison
Conversion funnel analytics

Commerce funnel drop-off investigation

A consistent session funnel, observed counts and step-level rates distinguish absolute leakage from the largest proportional drop-off.

Funnel diagnosticsStage reconciliationConversion rates
Operations performance analytics

Support queue cycle-time study

Median and 90th-percentile resolution times are compared across queues, alongside illustrative SLA exceptions that can guide further root-cause review.

Quantile analysisSLA exceptionsQueue segmentation
Marketing efficiency analytics

B2B channel acquisition efficiency

Five channels are compared on lead volume, realized wins and spend-per-win, with a rate-versus-cost view for defensible budget discussions.
Cost per acquisitionChannel segmentationEfficiency scatter

Data Analytics Frequently Asked Questions

Depending on the selected package, the service can include data cleaning, validation, exploratory analysis, KPI definition, trend and segment analysis, charts, dashboard development, insight summaries and handover files. The exact scope is confirmed against your data and business question before execution.
Structured sources such as Excel workbooks, CSV files, Google Sheets exports and database or business-system extracts can be assessed. Compatibility, volume, field structure and access requirements are reviewed during scoping.
Yes. The agreed scope can include duplicate review, missing-value checks, type and format corrections, category standardization, mapping and documented exclusions. Work that requires extensive data engineering or source-system repair may need a custom scope.
Yes, when the sources can be connected through compatible identifiers, dates or business definitions. Multi-source work can require mapping, reconciliation and data-model design, so it is normally suited to the Professional, Advanced or a custom package.
Yes. Dashboard delivery can be included where the selected package and source data support it. The platform, page count, measures, filters and refresh approach are agreed before the build starts.
Typical work can include descriptive analysis, trend and variance analysis, segmentation, cohort-style comparisons, KPI reporting, exception analysis and diagnostic exploration. Predictive modelling, machine learning and real-time analytics are scoped separately when required.
The standard packages are planned for approximately 3, 5 and 7 business days after complete inputs are available. Large datasets, access delays, extensive cleaning, complex modelling or additional stakeholder review can change the timeline.
Please provide the source data, the business question or decision you need to support, known KPI definitions, the intended audience, preferred output format, any known data-quality issues, your deadline and relevant confidentiality or access requirements.
Yes, the agreed editable outputs are included according to package scope. This may include cleaned datasets, Excel workbooks, dashboard files, SQL or Python analysis files where used, metric definitions and handover notes.
Revisions cover consolidated feedback on the agreed analysis and presentation scope. New data sources, new business questions, major metric changes or additional dashboard pages may require a scope adjustment rather than a standard revision.
Confidentiality and access requirements should be discussed before transfer. Send only data necessary for the project, remove unnecessary sensitive information where practical, and identify any regulated, restricted or special-handling requirements before access is provided.
Not by default. The fixed packages focus on descriptive, diagnostic and reporting-oriented analytics. Forecasting, predictive modelling, machine learning, real-time pipelines or production data engineering can be assessed as a separate custom engagement.

Client Reviews — Data Visualization

These supplied reviews retain the original customer wording, rating, timeline, location and Data Visualization service label.

M
Marcus Lee
🇸🇬 Singapore
Data Visualization
★ 5 / 5   •   5 months ago

Our previous approach to Data Visualization was producing inconsistent results, so we asked the team to build a suite of clear, presentation-ready data visualizations with stronger controls. A lot of value came from the attention to accessibility, story flow, chart choice, visual hierarchy, labeling, and interaction design. Instead of hiding uncertainty, the team documented it and showed us where additional data or different assumptions would change the result. The final result gave us complex results that stakeholders could understand quickly without lengthy explanation. We received editable visual assets, source mappings, style rules, and reusable layouts, and the transition into day-to-day use was smooth.

V
Vikram Shah
🇮🇳 India
Data Visualization
★ 5 / 5   •   3 weeks ago

We engaged the team on Data Visualization to create a suite of clear, presentation-ready data visualizations, and they were careful not to overcomplicate the solution. The team worked methodically through chart choice, visual hierarchy, labeling, interaction design, accessibility, and story flow. That made revisions faster because issues were isolated, documented, and resolved rather than repeatedly resurfacing. Most importantly, we ended up with complex results that stakeholders could understand quickly without lengthy explanation. The team packaged editable visual assets, source mappings, style rules, and reusable layouts in a way that made the next stage straightforward.

N
Nathan Petit
🇫🇷 France
Data Visualization
★ 4.9 / 5   •   1 month ago

The Data Visualization assignment involved several dependencies, but the team organized the work around a suite of clear, presentation-ready data visualizations and kept each milestone reviewable. The project stayed controlled because the team treated labeling, interaction design, accessibility, story flow, chart choice, and visual hierarchy as core requirements, not optional polish to be added at the end. The final result gave us complex results that stakeholders could understand quickly without lengthy explanation. We received editable visual assets, source mappings, style rules, and reusable layouts, and the transition into day-to-day use was smooth.

M
Mia Collins
🇺🇸 United States
Data Visualization
★ 4.8 / 5   •   6 weeks ago

We hired the team for Data Visualization with a clear objective: deliver a suite of clear, presentation-ready data visualizations without creating a solution that was too fragile to maintain. We appreciated the discipline around accessibility, story flow, chart choice, visual hierarchy, labeling, and interaction design. The team kept technical detail available when we needed it, while still making review sessions understandable for business stakeholders. Most importantly, we ended up with complex results that stakeholders could understand quickly without lengthy explanation. The team packaged editable visual assets, source mappings, style rules, and reusable layouts in a way that made the next stage straightforward.

C
Charlotte Evans
🇬🇧 United Kingdom
Data Visualization
★ 5 / 5   •   2 months ago

For this Data Visualization project, we needed a suite of clear, presentation-ready data visualizations that could stand up to real operational use rather than a one-off demonstration. They kept a close eye on chart choice, visual hierarchy, labeling, interaction design, accessibility, and story flow. Progress updates were concise, and the evidence behind important decisions was easy for us to verify. The final result gave us complex results that stakeholders could understand quickly without lengthy explanation. We received editable visual assets, source mappings, style rules, and reusable layouts, and the transition into day-to-day use was smooth.

L
Liam Martin
🇨🇦 Canada
Data Visualization
★ 4.9 / 5   •   3 months ago

We chose a specialist for Data Visualization because our requirements called for a suite of clear, presentation-ready data visualizations with measurable quality rather than a generic template. A lot of value came from the attention to labeling, interaction design, accessibility, story flow, chart choice, and visual hierarchy. Instead of hiding uncertainty, the team documented it and showed us where additional data or different assumptions would change the result. Most importantly, we ended up with complex results that stakeholders could understand quickly without lengthy explanation. The team packaged editable visual assets, source mappings, style rules, and reusable layouts in a way that made the next stage straightforward.

DATA ANALYTICS ENQUIRY

Request a Data Analytics Scope Review

Tell us what data you have, what question or reporting need you want to address, and what output your team expects. Rudrriv will use that information to assess fit, package scope and any important dependencies.

What to include in your analytics brief

A useful brief focuses on the decision, data and output. Do not send passwords, access tokens or unnecessary sensitive personal data through this form.

Business questionExplain the decision, problem, variance or recurring reporting need the analysis should support.
Data sources & sizeList Excel, CSV, Google Sheets, database or system exports, approximate row volume, date range and known quality issues.
KPIs & definitionsShare existing formulas, filters, exclusions, targets or business rules that should be preserved or reviewed.
Required outputSpecify whether you need a cleaned dataset, workbook, dashboard, presentation-ready charts, insight report or combination.
Deadline & constraintsInclude your deadline, platform preference, access requirements, confidentiality needs and any dependency that could affect delivery.
Helpful to include: business question, source formats, approximate volume, KPI definitions, expected audience, preferred package, output format and deadline.
DATA ANALYTICS ENQUIRY

Share Your Data Analytics Requirement

Provide your contact details and a concise project brief. Your enquiry will be sent directly to support@rudrriv.com for review.

Please include enough context for Rudrriv to assess the analytical scope and delivery dependencies. Your information is used to respond to this enquiry.