
Commerce performance cockpit
An executive-ready reporting interface with fiscal revenue, channel mix, regional variance and delivery KPIs.
Revenue trendsChannel mixRegional scorecards

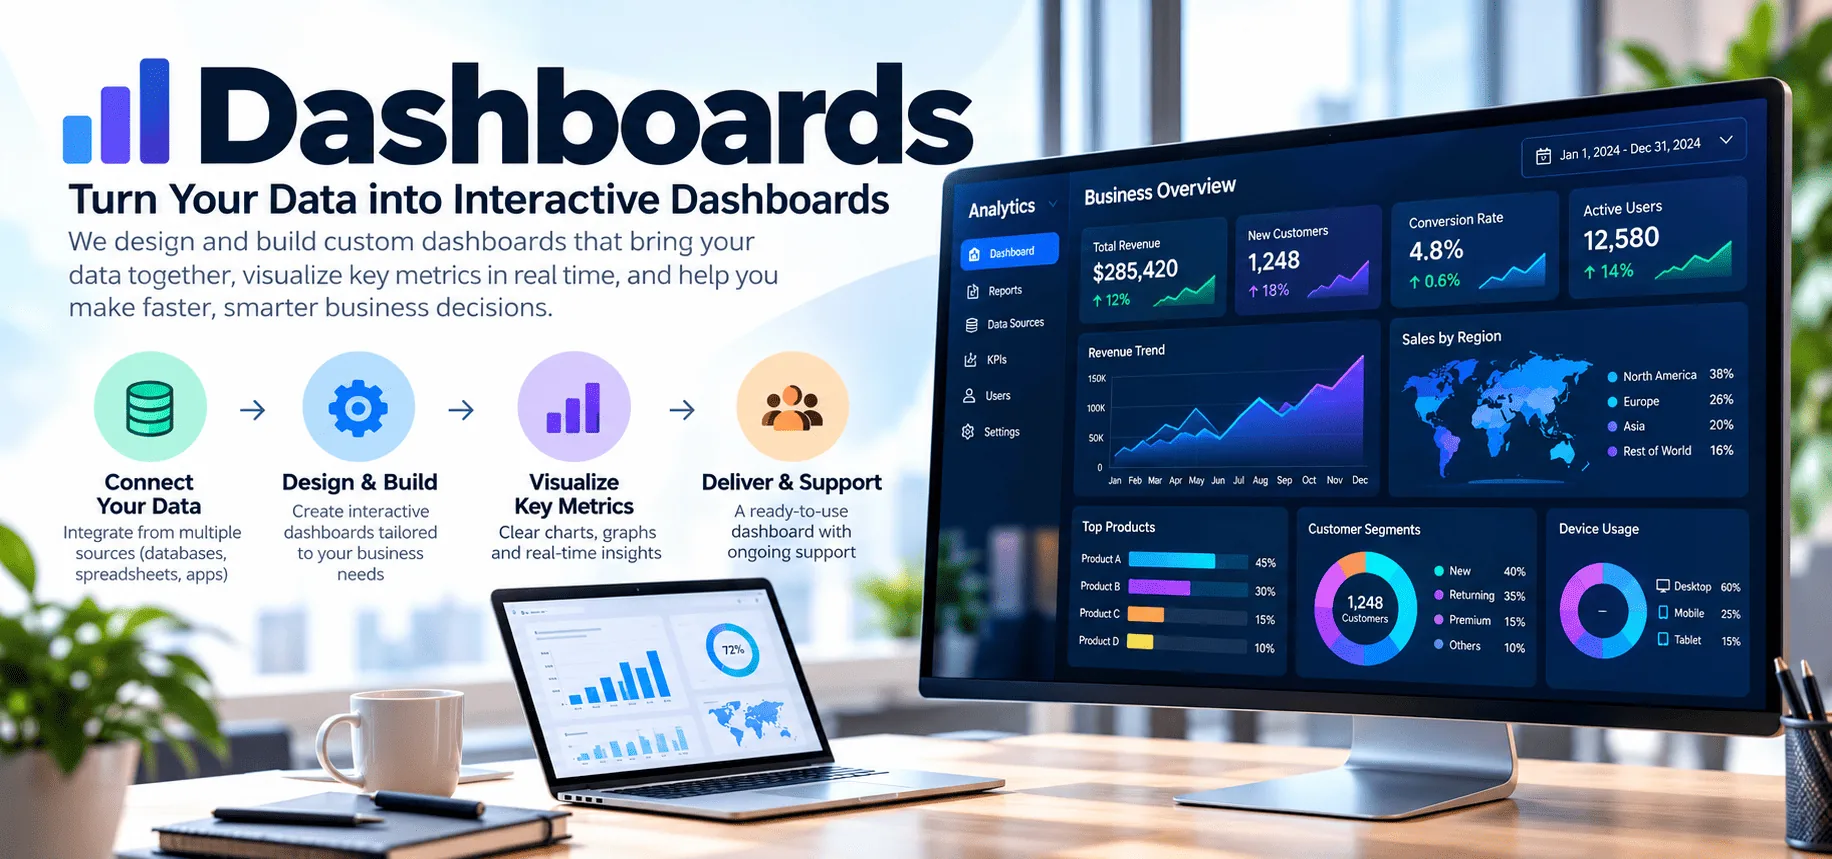
A business dashboard brings selected metrics, trends and operational signals into one interactive reporting experience. Rudrriv's service is designed for teams that need a dashboard built around real decision-making requirements, not a generic chart template. The work starts with what the audience needs to understand, then maps those questions to the available data, KPI logic and suitable BI platform.
Typical projects include executive scorecards, sales reporting, finance and budget dashboards, marketing performance views, operations monitoring, customer-support reporting and department-level KPI dashboards. Depending on scope, the build may include spreadsheet or database inputs, data shaping, relational modelling, calculated measures, filters, drill-through, role-based views and refresh configuration.
Share the source files or approved data-access method, the reporting audience, the business questions you need answered, KPI definitions where available, required filters, reporting period, refresh expectations, preferred platform if already chosen, and any existing reports or screenshots that explain the current process. If data access depends on private systems, credentials should remain in your controlled environment and be provided through an approved secure method.
We clarify the audience, business questions, KPI definitions and what decisions the dashboard must support.
Rudrriv reviews the supplied sources, structures the model and documents assumptions or data limitations that affect reporting.
The dashboard is built with appropriate measures, filters, interactions and layout, then checked against agreed KPI logic and sample results.
Consolidated feedback is applied, final files are prepared and deployment, refresh or handoff guidance is provided within scope.
Dashboard quality depends on more than visual polish. Rudrriv checks whether measures use the intended grain and filters, whether totals reconcile to source data, whether labels and units are clear, whether interactions behave predictably, and whether the information hierarchy works for the intended audience. Performance, refresh frequency and security also depend on dataset size, connector behaviour, licences, gateway architecture and platform limits.
Choose by dashboard breadth, number of data sources, modelling depth and deployment needs. Third-party BI licences and paid connectors are separate.
| Included | ₹4,999 Essential KPI Starter Dashboard For a focused view built from one clean, well-defined source. |
₹14,999 Professional Recommended Business Performance Dashboard For multi-page reporting with stronger transformation, modelling and interaction. |
₹29,999 Advanced Multi-Source BI Dashboard For broader reporting with advanced modelling, security and structured deployment support. |
|---|---|---|---|
| Dashboard/report pages | 1 | Up to 3 | Up to 5 |
| Data sources | 1 | Up to 3 | Up to 5 |
| KPIs / calculated measures | Up to 6 | Up to 15 | Up to 25 |
| Data transformation | Basic | Included | Advanced |
| Data modelling | Basic | Relational | Advanced |
| Filters / drill-through | Filters | Filters + drill-through | Advanced navigation + drill-through |
| Scheduled refresh setup | Guidance | Where supported | Where supported |
| Row-level security | — | — | Where supported |
| Documentation | Handoff notes | Model + measure notes | Technical handoff documentation |
| Revision rounds | 1 | 2 | 3 |
| Standard delivery | 4 business days | 7 business days | 10 business days |
| Package price | ₹4,999 | ₹14,999 | ₹29,999 |
Explore five distinct reporting experiences that demonstrate how KPIs, meaningful comparisons and operational context can be brought together in decision-ready dashboards.
An executive-ready reporting interface with fiscal revenue, channel mix, regional variance and delivery KPIs.
A recurring-revenue command centre with MRR movements, cohort retention and product-tier contribution.
An operations dashboard for shipment throughput, fulfilment targets, stock coverage and replenishment alerts.
A service team overview combining open versus resolved workload, SLA adherence, channel mix and escalation status.
A finance reporting interface for inflow versus outflow, cost composition, budget variance and working capital.
Reviews are displayed with the original service label supplied for each testimonial.
We engaged the team on Data Collection to create a documented data-collection process and consolidated dataset, and they were careful not to overcomplicate the solution. They kept a close eye on sampling approach, consistency, completeness, collection controls, and documentation. Progress updates were concise, and the evidence behind important decisions was easy for us to verify. The work ultimately produced a stronger dataset with fewer gaps and much better traceability back to the original sources. We also valued receiving source logs, collection templates, validated files, and repeatable collection instructions, which made the solution much easier to audit and maintain.
The Data Collection assignment involved several dependencies, but the team organized the work around a documented data-collection process and consolidated dataset and kept each milestone reviewable. A lot of value came from the attention to completeness, collection controls, documentation, source coverage, and sampling approach. Instead of hiding uncertainty, the team documented it and showed us where additional data or different assumptions would change the result. We came away with a stronger dataset with fewer gaps and much better traceability back to the original sources. The final source logs, collection templates, validated files, and repeatable collection instructions were practical and detailed enough for both review and ongoing operation.
We hired the team for Data Collection with a clear objective: deliver a documented data-collection process and consolidated dataset without creating a solution that was too fragile to maintain. The team worked methodically through documentation, source coverage, sampling approach, consistency, and completeness. That made revisions faster because issues were isolated, documented, and resolved rather than repeatedly resurfacing. The work ultimately produced a stronger dataset with fewer gaps and much better traceability back to the original sources. We also valued receiving source logs, collection templates, validated files, and repeatable collection instructions, which made the solution much easier to audit and maintain.
Tell us what decisions the dashboard should support, where the data lives, who needs access and how often the reporting should refresh. Rudrriv will assess the scope and recommend the most suitable delivery approach.