
We provide Data Visualization & Interactive Dashboard Services

Seller
Rudrriv Technologies
★★★★★4.9 (3,657 reviews)
✦Turn reporting data into clear, decision-ready charts and dashboards with defined requirements, quality review and final delivery.
✦Service Highlights
  • Professional dashboard and data visualization execution from requirements through delivery.
  • KPI definition, chart selection, visual hierarchy and data storytelling aligned to the intended business audience.
  • Support for common reporting tools including Power BI, Tableau, Looker Studio, Excel and Google Sheets when suitable.
  • Packages scale from a focused visual report to multi-source interactive BI dashboards with deployment support.
  • Editable files, validation notes and documentation are included where relevant to the selected scope.

What Clients Appreciate

The supplied featured review below is presented with its original service label and factual details.

S
Sara Nasser🇦🇪 United Arab Emirates★★★★★ 5
Service: Data Tagging & Annotation
We brought the team in for Data Tagging & Annotation after struggling to get a dependable result internally, and the project became much more structured from the first review. The team tested and refined the work around annotator consistency, quality assurance, throughput tracking, labeling guidelines, and taxonomy design, while keeping the implementation realistic for our existing tools and processes. The delivery translated into training data that was substantially more consistent and ready for downstream model work. Having annotation guidelines, QA logs, labeled files, and documented exceptions alongside it made the result much easier to review, adopt, and extend.
5 months ago

About This Data Visualization Service

Clearer reporting, better chart choices and dashboards built around the decisions people need to make

Data visualization turns business data into charts, dashboards and visual reports that make patterns, comparisons, trends and exceptions easier to understand. Rudrriv provides the service from brief to delivery: requirements are translated into a practical visualization scope, the work is reviewed for clarity and consistency, and the final dashboard or report is delivered with the agreed files and documentation.

What’s included
  • Requirements and KPI review: clarify the audience, business questions, measures, definitions and decisions the visualization should support.
  • Data readiness check: review the supplied source structure and identify cleaning, reshaping or calculation work required for the agreed dashboard.
  • Visualization design: choose suitable chart types, information hierarchy, labels, filters, colours and layout for fast interpretation rather than decorative complexity.
  • Dashboard development: build the agreed report pages, visuals, calculated metrics and interactions in the selected platform.
  • Validation and QA: check key calculations against source data, review filter behaviour and verify that the final views match the approved scope.
  • Delivery and handover: provide the applicable source file, exports, notes, documentation and deployment guidance included in the selected package.
What we need from you

Share the data file or representative sample, the metrics and questions that matter, the intended users, preferred platform if any, examples of current reports, required refresh frequency, access or security needs, brand guidelines and deadline. If KPI definitions are unclear, Rudrriv can help structure them during scope assessment rather than building charts around ambiguous measures.

How the service delivery process works
01
Requirements & data review

We confirm the audience, KPIs, source data, platform, refresh needs and scope boundaries before production starts.

02
Visual structure & build

The dashboard is developed around suitable chart types, calculations, information hierarchy and the selected tool.

03
Validation & refinement

Key numbers, interactions and visual clarity are reviewed, then included revision rounds are applied to consolidated feedback.

04
Delivery & handover

Approved files, exports and documentation are supplied, with publishing or refresh support where included in scope.

Built for practical business use

A professional dashboard should answer a defined question quickly, use the right level of detail for its audience and avoid forcing users to decode unnecessary visual noise. The service therefore focuses on readable hierarchy, meaningful comparisons, consistent definitions and interactions that help people explore the data without losing context. Platform licences, enterprise infrastructure and extensive data engineering are treated separately so the visualization scope remains clear.

Typical outputs
KPI dashboards
Executive reports
Interactive visual analysis
Common platforms
Power BI, Tableau
Looker Studio
Excel & Google Sheets
Useful inputs
Data files / source access
KPI definitions
Audience & refresh needs

Compare Data Visualization Packages

Choose a focused visual build for a clean dataset, an interactive KPI dashboard for recurring business reporting, or an advanced multi-source dashboard when modelling, access control and deployment support are required.

Included
₹4,999
Essential
Visualization Starter
A focused, professionally designed visualization or single-page dashboard built from one clean data source.
₹14,999
Professional Recommended
Interactive KPI Dashboard
An interactive business dashboard with calculated KPIs, filters and a clearer analytical structure for routine reporting.
₹39,999
Advanced
Multi-Source BI Dashboard
A broader BI visualization build for multi-source reporting, deeper analysis, controlled access and deployment-ready handover.
Dashboard pages1Up to 2Up to 4
Charts / KPI visualsUp to 5Up to 10Up to 20
Data sources1Up to 2Up to 4
Data preparationBasicIncludedIncluded
Calculated metricsBasicIncludedAdvanced
Interactive filters / slicersAs supported✓✓
Drill-down / drill-through—As applicable✓
Row-level security setup——As supported
Refresh / deployment configuration—GuidanceSetup support
DocumentationScope notesValidation notesDocumentation + handover
Revision rounds234
Standard delivery3 days5 days8–10 days
Editable source fileWhere supported✓✓
Package price
₹4,999
₹14,999
₹39,999
VISUALIZATION PORTFOLIO 05 CONCEPT STUDIES

Data visualization that makes patterns visible

Five distinct, client-style examples of how carefully chosen charts transform raw measures into visuals people can interpret. Each artwork uses synthetic, demonstrative data and represents a possible deliverable—not a completed client commission.

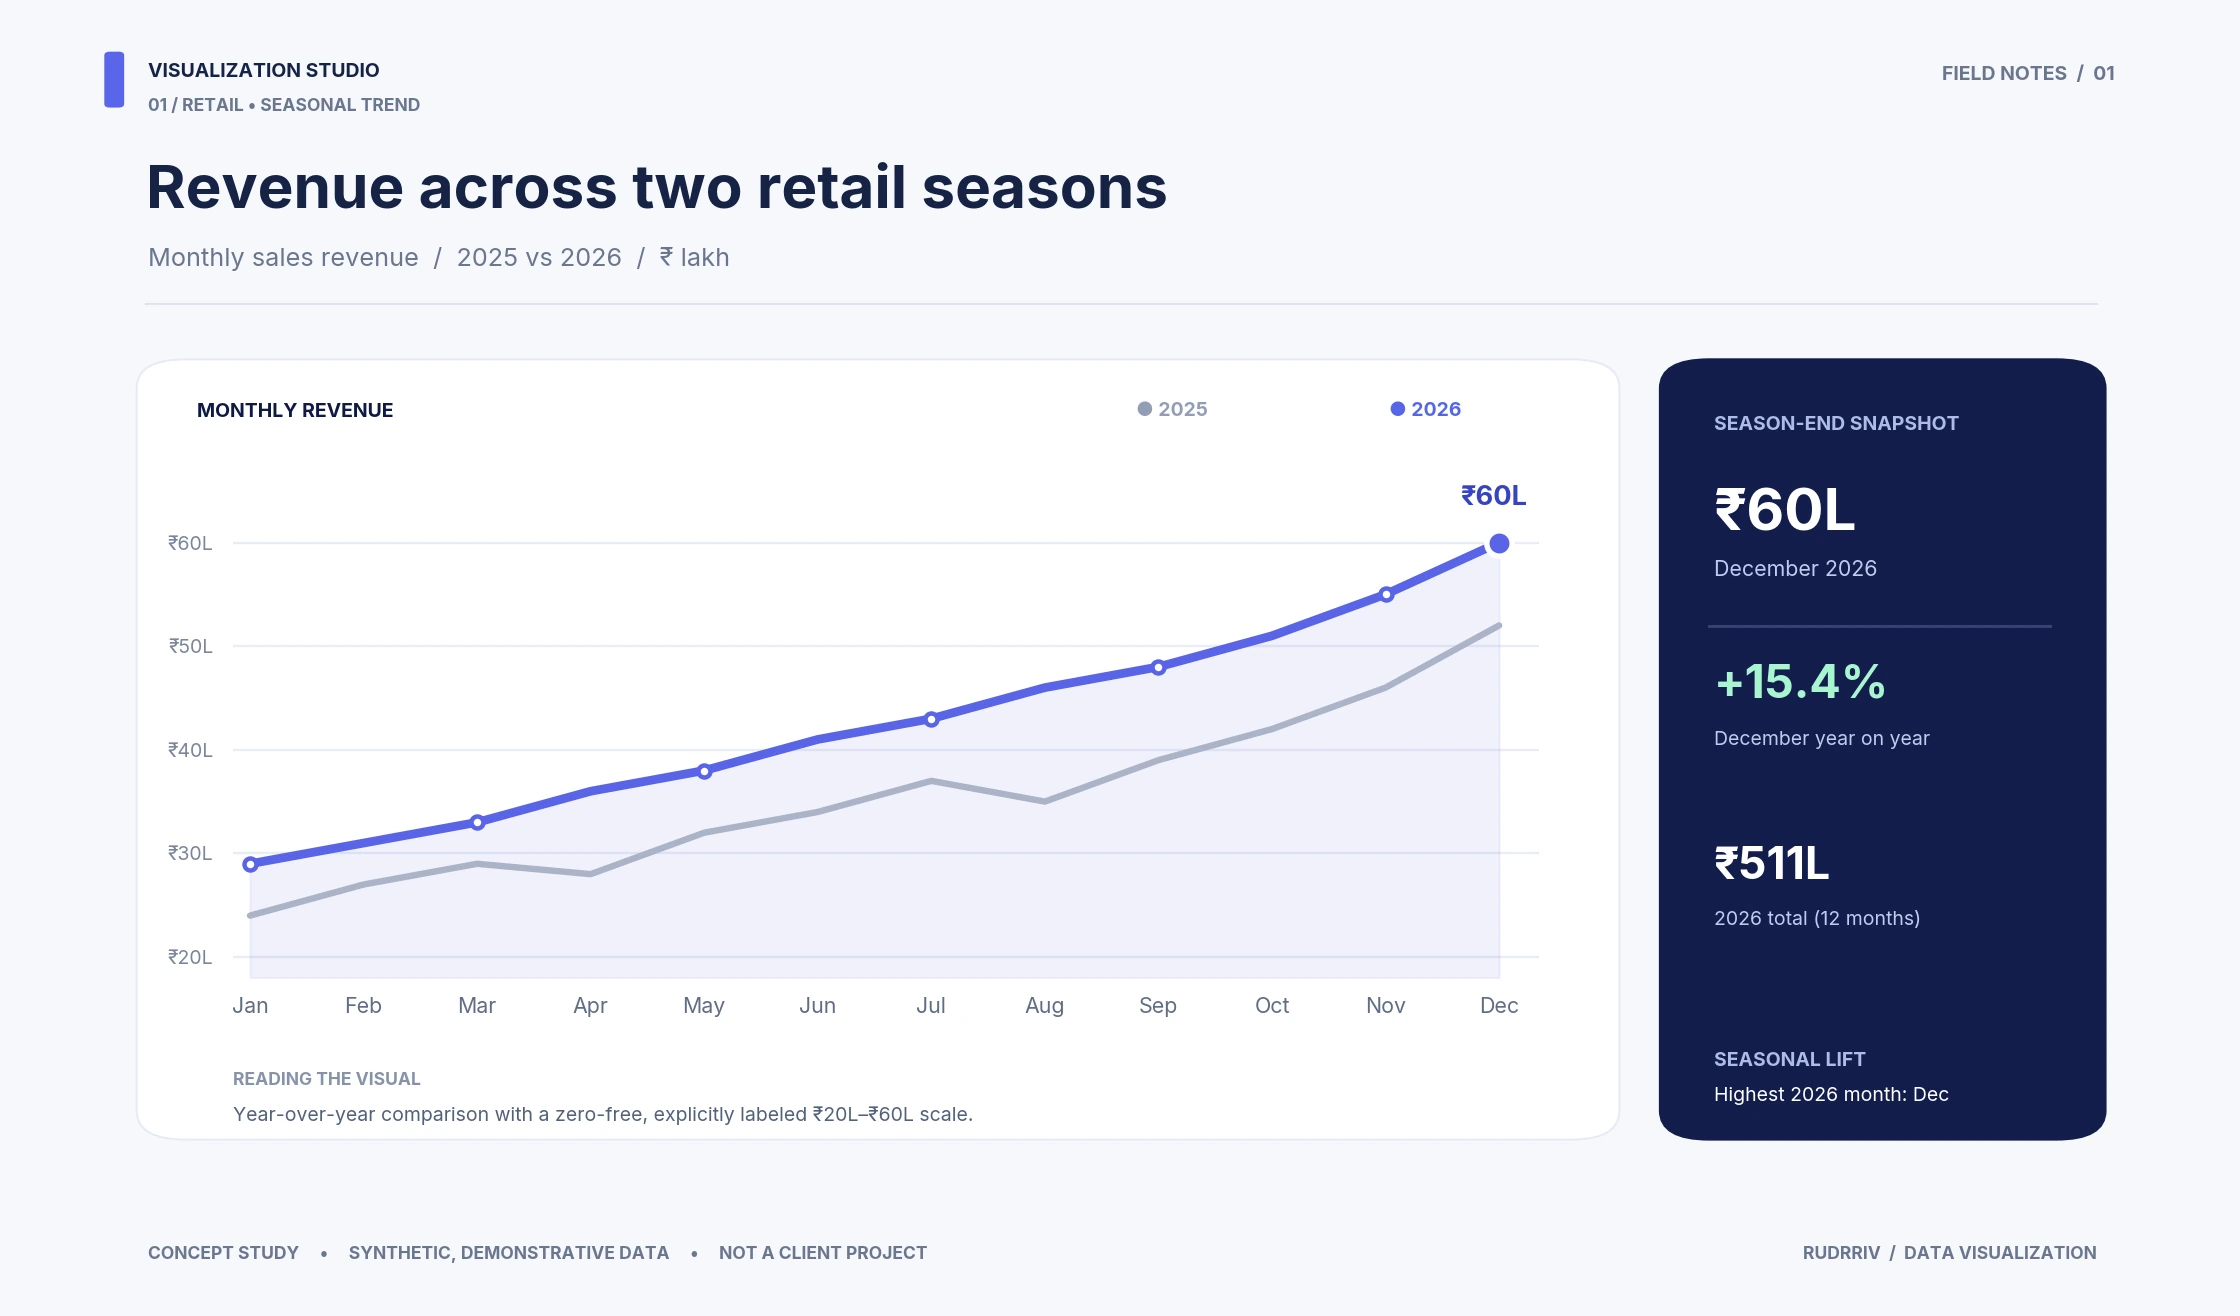
DATA VISUALIZATION Time-Series Data Visualization

Revenue Across Two Retail Seasons

A comparative line-chart story that makes monthly movement, year-over-year changes and seasonal peaks easy to read.

Comparative trends Labeled units Seasonality
DATA VISUALIZATION Temporal Heatmap Visualization

When the Station Gets Busy

A day-by-hour passenger-intensity heatmap built to reveal commuter patterns and the busiest arrival periods.

Day × hour matrix Intensity legend Peak annotations
DATA VISUALIZATION Sankey Flow Visualization

A Thousand Orders in Flow

A proportional flow visual connecting acquisition channels to product categories across a one-thousand-order example.

Weighted connections Category mix Source-to-outcome
DATA VISUALIZATION Ranked Comparison Visualization

How Delivery Times Shifted

A paired-dot comparison that highlights changes in median delivery minutes across ten example cities.

Paired-dot plot Ranked regions Quarter comparison
DATA VISUALIZATION Distribution Visualization

Resolution Beyond the Average

Four violin plots illustrate ticket-resolution variability, medians and the middle fifty percent across priority levels.
Violin plots Median & quartiles Distribution shapes

Frequently Asked Questions

The service can include requirements review, KPI definition, chart and dashboard design, data preparation, calculations, interactive filters, validation, source files, documentation and publishing support depending on the selected package.
Share the data source or a representative sample, the business questions you need answered, KPI definitions if they already exist, the intended audience, preferred platform, refresh expectations, brand guidelines and any existing reports that should be matched or improved.
Rudrriv can scope work around common tools such as Power BI, Tableau, Looker Studio, Excel and Google Sheets. The most suitable platform depends on your data sources, user access, licensing, interactivity, refresh and deployment requirements.
Yes, reasonable data cleaning, reshaping and metric preparation can be included when it is necessary for the agreed visualization scope. Large-scale data engineering, warehouse design or complex ETL may require a custom quote.
Rudrriv’s packaged data visualization work starts at ₹4,999 for a focused visualization build. The Professional package is ₹14,999 and the Advanced package is ₹39,999. Complex integrations, large datasets, enterprise security or extensive data engineering are quoted separately.
A focused visualization can typically be delivered in about 3 days, an interactive KPI dashboard in about 5 days, and a broader multi-source dashboard in about 8 to 10 days once usable data and requirements are available.
Yes. You can provide screenshots, workbook files, report exports or access to an existing dashboard. Rudrriv can rebuild the structure, improve chart selection and hierarchy, refine calculations and make the result easier to review and use.
Yes, editable source files are included where the selected platform and package support them. Third-party platform licences, proprietary connectors and client-owned credentials remain separate from the service fee.
Scheduled or automated refresh can be configured in the Advanced scope when the chosen platform, data source and client licensing support it. Gateway, credential, API and security requirements are reviewed before deployment.
Advanced dashboard work can include supported row-level security or audience-specific views when the platform and data model allow it. The exact access model should be defined during requirements review and tested before handover.

Client Reviews

These supplied client reviews are displayed exactly with their original Data Tagging & Annotation service labels, names, countries, ratings and timelines.

C
Camille Martin
🇫🇷 France
Data Tagging & Annotation
★★★★★ 5   •   3 weeks ago

The scope for Data Tagging & Annotation looked straightforward at first, but the underlying data issues made it more complex. The team still kept the project focused around a quality-controlled tagged and annotated dataset. We appreciated the discipline around throughput tracking, labeling guidelines, taxonomy design, edge cases, and annotator consistency. The team kept technical detail available when we needed it, while still making review sessions understandable for business stakeholders. The outcome was training data that was substantially more consistent and ready for downstream model work, and the inclusion of annotation guidelines, QA logs, labeled files, and documented exceptions made it possible for us to keep improving the work internally.

Service: Data Tagging & Annotation
D
Daniel Brooks
🇺🇸 United States
Data Tagging & Annotation
★★★★★ 4.9   •   1 month ago

This was our first outsourced Data Tagging & Annotation project, and we needed a quality-controlled tagged and annotated dataset with enough documentation for our internal team to take over confidently. They kept a close eye on taxonomy design, edge cases, annotator consistency, quality assurance, and throughput tracking. Progress updates were concise, and the evidence behind important decisions was easy for us to verify. In the end, the work provided training data that was substantially more consistent and ready for downstream model work. The documented annotation guidelines, QA logs, labeled files, and documented exceptions made the result easy to verify, reuse, and extend.

Service: Data Tagging & Annotation
A
Amelia Turner
🇬🇧 United Kingdom
Data Tagging & Annotation
★★★★★ 4.8   •   6 weeks ago

We asked the team to revisit our Data Tagging & Annotation process and produce a quality-controlled tagged and annotated dataset; their approach was structured from discovery through final validation. A lot of value came from the attention to annotator consistency, quality assurance, throughput tracking, labeling guidelines, and taxonomy design. Instead of hiding uncertainty, the team documented it and showed us where additional data or different assumptions would change the result. The outcome was training data that was substantially more consistent and ready for downstream model work, and the inclusion of annotation guidelines, QA logs, labeled files, and documented exceptions made it possible for us to keep improving the work internally.

Service: Data Tagging & Annotation
B
Benjamin Clark
🇨🇦 Canada
Data Tagging & Annotation
★★★★★ 5   •   2 months ago

Our previous approach to Data Tagging & Annotation was producing inconsistent results, so we asked the team to build a quality-controlled tagged and annotated dataset with stronger controls. The team worked methodically through throughput tracking, labeling guidelines, taxonomy design, edge cases, and annotator consistency. That made revisions faster because issues were isolated, documented, and resolved rather than repeatedly resurfacing. In the end, the work provided training data that was substantially more consistent and ready for downstream model work. The documented annotation guidelines, QA logs, labeled files, and documented exceptions made the result easy to verify, reuse, and extend.

Service: Data Tagging & Annotation
M
Matilda Scott
🇦🇺 Australia
Data Tagging & Annotation
★★★★★ 4.9   •   3 months ago

We engaged the team on Data Tagging & Annotation to create a quality-controlled tagged and annotated dataset, and they were careful not to overcomplicate the solution. The project stayed controlled because the team treated taxonomy design, edge cases, annotator consistency, quality assurance, and throughput tracking as core requirements, not optional polish to be added at the end. The outcome was training data that was substantially more consistent and ready for downstream model work, and the inclusion of annotation guidelines, QA logs, labeled files, and documented exceptions made it possible for us to keep improving the work internally.

Service: Data Tagging & Annotation
A
Adrian Ng
🇸🇬 Singapore
Data Tagging & Annotation
★★★★★ 4.7   •   4 months ago

The Data Tagging & Annotation assignment involved several dependencies, but the team organized the work around a quality-controlled tagged and annotated dataset and kept each milestone reviewable. We appreciated the discipline around annotator consistency, quality assurance, throughput tracking, labeling guidelines, and taxonomy design. The team kept technical detail available when we needed it, while still making review sessions understandable for business stakeholders. In the end, the work provided training data that was substantially more consistent and ready for downstream model work. The documented annotation guidelines, QA logs, labeled files, and documented exceptions made the result easy to verify, reuse, and extend.

Service: Data Tagging & Annotation

Request a Data Visualization Quote

Tell us what you need to report, which data you have, who will use the dashboard and how the result should be refreshed or shared. We will assess the scope and recommend the appropriate package or custom plan.

Business questions & KPIsExplain what decisions the dashboard should support and which measures, targets or definitions matter.
Data sources & readinessList the Excel files, CSVs, databases, APIs or reporting systems involved and whether the data is already clean.
Audience & reporting frequencyTell us who will use the dashboard, how often they review it and how frequently the data should refresh.
Platform & current reportsShare your preferred tool, existing workbooks or screenshots, and any design or brand guidelines that should be followed.
Access, refresh & securityInclude sharing requirements, user roles, row-level security, gateway or credential constraints where relevant.
Deadline & handover needsShare the target delivery date and whether you need source files, documentation, deployment support or training.
Helpful to include: sample data, required KPIs, dashboard users, preferred platform, number of pages, refresh frequency, security needs, examples you like and deadline.
DATA VISUALIZATION ENQUIRY

Request a Data Visualization Assessment

Share your contact details and reporting requirements below. Your enquiry will be sent directly to support@rudrriv.com for review.

Please include enough detail for us to assess the dashboard scope, data readiness and delivery timeline. We will use your information only to respond to this enquiry.