Retail shelf bounding boxes
Class-labelled cartons, bottles and cans with instance IDs, image coordinates and a visible QA inspector.
Bounding boxesCOCO / YOLOInstance labels

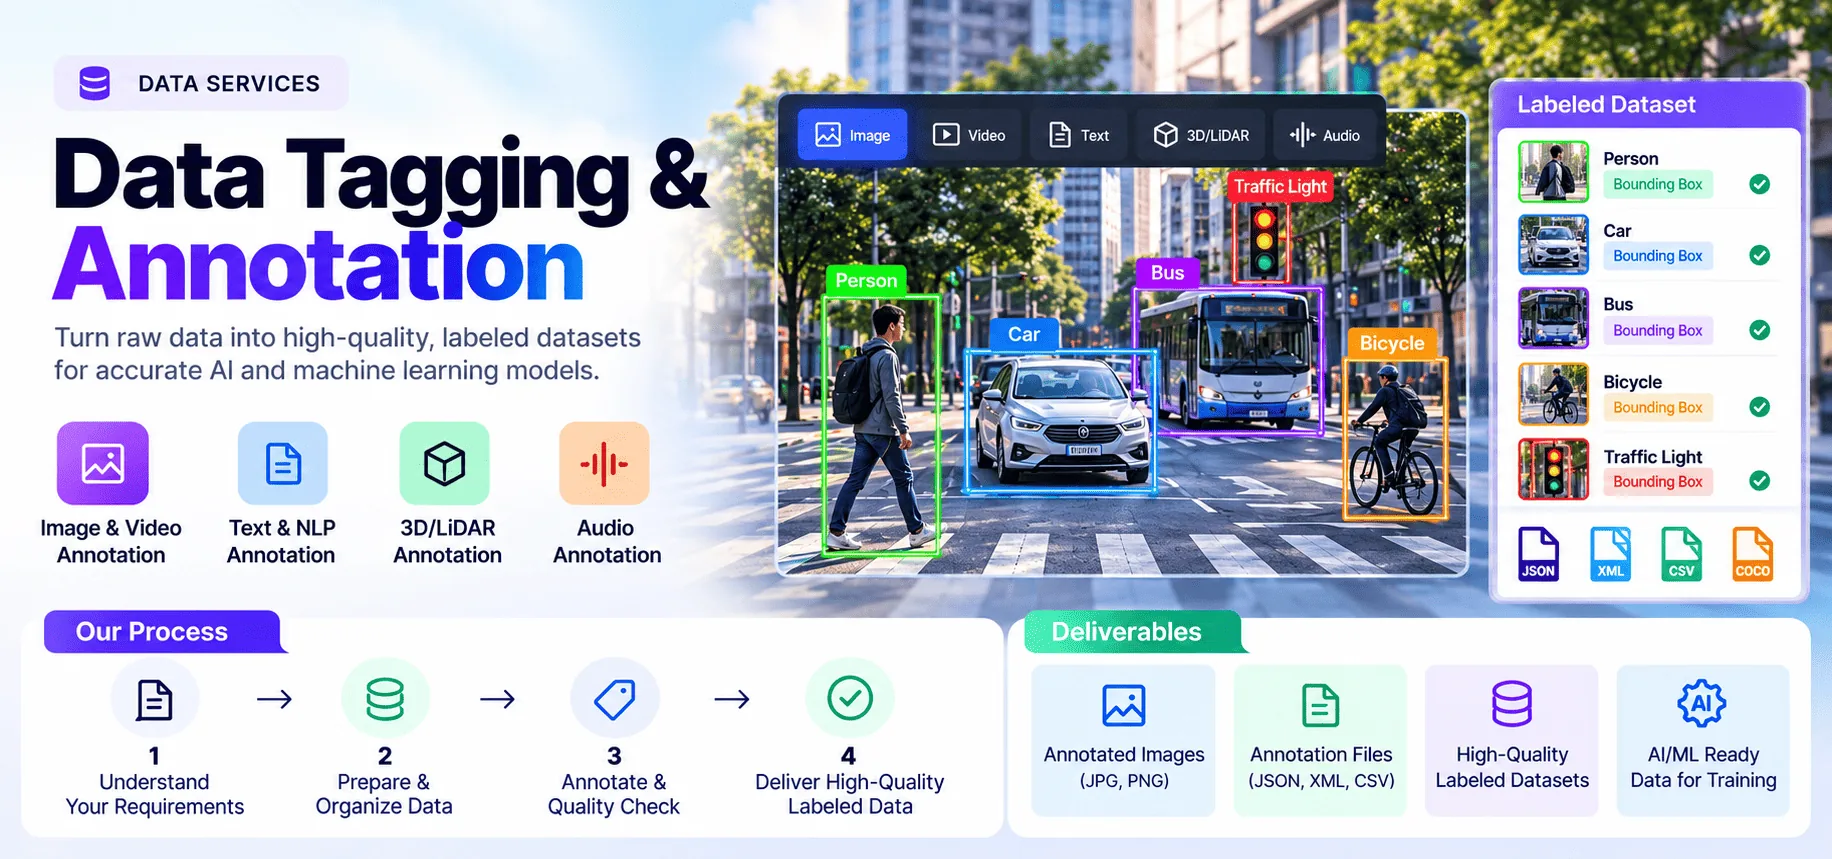
Data tagging and annotation converts unstructured or loosely structured material into labeled examples that machine-learning systems, search workflows, analytics pipelines and review teams can use. The work may be as simple as assigning one category to each record or as detailed as drawing object boundaries, marking keypoints, tagging named entities, linking relationships, segmenting audio or tracking events across video.
Rudrriv provides annotation around your requirements and label definitions. We translate the requirement into an annotation scope, apply the agreed quality checks and deliver the labeled data in the required structure.
Provide the dataset or approved access route, the business or model objective, label taxonomy, example annotations if available, rules for difficult cases, required output schema, tooling preference, data-security constraints and deadline. If your instructions are still evolving, a pilot batch is usually the safest way to calibrate the workflow before scaling.
We review the modality, taxonomy, examples, edge cases, volume, security and target format.
A sample or pilot is used when needed to resolve ambiguity before full production.
Rudrriv completes the annotation production flow against the agreed specification and quality checks.
Labels are checked using the review depth included in the package or custom scope.
The final dataset is checked for structural completeness and supplied in the agreed format.
Two datasets with the same number of files can require very different effort. Cost usually changes with the number of labels per item, object density, polygon or mask complexity, text ambiguity, video duration and frame sampling, audio quality, domain expertise, review depth and whether existing guidelines are production-ready. For that reason, high-volume or mixed-modality projects are quoted after a small scope assessment.
OUR WORK FIVE CONCEPT SAMPLES
Explore how structured annotations, clear label conventions and review-ready deliverables can look across image, text, audio and document datasets.
All five visuals are original representative concepts made using synthetic, illustrative data—not client projects or validated performance results.
Class-labelled cartons, bottles and cans with instance IDs, image coordinates and a visible QA inspector.
Multi-token issue mentions, order IDs, dates and product entities in a demonstrative text-labelling workflow.
Class-coded parcel polygons, editable vertices and boundary checks for an imagined aerial tile.
Speaker turns, dual-channel waveforms and a time-bounded sound event with export-ready segment fields.
Human-reviewed invoice ID, issue date, recipient and amount regions mapped to a structured output schema.
Have your own labeling specification? Tell us the modality, classes, data volume and review requirements.
Discuss your annotation projectData annotation concept
Representative concept • Synthetic data • Not a real customer commission. Use ← → keys to browse or Esc to close.
Choose a package based on annotation complexity, not just file count. These fixed scopes are designed for clearly defined starter batches; larger production datasets receive a custom quote.
| Included | ₹999 Essential Dataset Tagging Starter For straightforward classification or single-label tagging. | ₹4,999 Professional Recommended Structured Annotation Batch For bounding boxes or text-entity spans with stronger QA. | ₹19,999 Advanced Complex Annotation & QA For polygons, segmentation, keypoints or relation-rich records. |
|---|---|---|---|
| Included volume | Up to 500 simple records | Up to 1,500 boxes or entity spans | Up to 250 complex items |
| Typical task | Single-label classification | Object detection or NER | Polygons / segmentation / keypoints / relations |
| Taxonomy check | ✓ | ✓ | ✓ |
| Pilot / calibration | — | ✓ | ✓ |
| Quality review | Spot check | Two-pass QA | Dedicated QA review |
| Formats | CSV / JSON | CSV / JSON / COCO / YOLO / VOC | Agreed model-ready schema |
| Correction rounds | 1 | 2 | 2 |
| Standard delivery | 3 days | 5 days | 7 days |
| Package price | ₹999 | ₹4,999 | ₹19,999 |
The exact workflow depends on what the model or business process needs to learn from the data.
Prepare images or video frames for detection, segmentation, tracking or pose tasks.
Structure language data for classification, extraction and conversational systems.
Mark speech, speakers, events or time boundaries for multimedia models.
Label records for extraction, routing, search, QA or intelligent document processing.
The supplied reviews for this page are for Rudrriv's Dashboards service. They are shown with their original service label rather than being represented as Data Tagging & Annotation reviews.
For this Dashboards project, we needed an interactive KPI dashboard for ongoing operational reporting that could stand up to real operational use rather than a one-off demonstration. The team worked methodically through KPI definitions, filters, drill-downs, refresh logic, performance, and user experience. That made revisions faster because issues were isolated, documented, and resolved rather than repeatedly resurfacing. The project achieved a single reporting view that reduced manual updates and made recurring reviews faster. The team also supplied the dashboard, data connections, metric documentation, and maintenance notes, so we were not left dependent on undocumented knowledge.
We chose a specialist for Dashboards because our requirements called for an interactive KPI dashboard for ongoing operational reporting with measurable quality rather than a generic template. The project stayed controlled because the team treated drill-downs, refresh logic, performance, user experience, KPI definitions, and filters as core requirements, not optional polish to be added at the end. We finished the engagement with a single reporting view that reduced manual updates and made recurring reviews faster. The handover of the dashboard, data connections, metric documentation, and maintenance notes was clear, complete, and more useful than a simple final file drop.
Our priority in Dashboards was reliability. The team designed an interactive KPI dashboard for ongoing operational reporting with that requirement visible in every stage of the project. We appreciated the discipline around performance, user experience, KPI definitions, filters, drill-downs, and refresh logic. The team kept technical detail available when we needed it, while still making review sessions understandable for business stakeholders. The project achieved a single reporting view that reduced manual updates and made recurring reviews faster. The team also supplied the dashboard, data connections, metric documentation, and maintenance notes, so we were not left dependent on undocumented knowledge.
Tell us what data you have, how it needs to be labeled, the approximate volume, output format and quality requirements. Rudrriv will assess the scope and respond with the most suitable package or a custom plan.