
Outlier in Data Analytics: Meaning, Detection and Decisions
An outlier is a data point that differs markedly from the other observations in a dataset. In business analytics, it might be an unusually large customer complaint count, a high-value order, a negative delivery duration, an unexpected transaction amount, or a sudden change in website conversions. An outlier is a signal to investigate—not automatic proof that the value is wrong. The practical question is whether the observation represents a data error, a genuine but rare event, a change in business conditions, or a pattern that your current analysis fails to explain. The value becomes useful when analysts connect the number to a specific event, an affected decision, and a clear owner for follow-up.
Consider an Indian ecommerce team measuring customer complaints by day. Most days show 5–12 cases, but one day records 43. Deleting 43 to make a chart look smoother could conceal a fulfilment issue. Treating it as a permanent forecasting baseline could also distort staffing plans. The right response is to check the source records, the number of orders, the complaint categories, any promotional event, and whether the spike occurs within one region or channel. A single exceptional number may contain more operational information than a full month of ordinary results.
The same challenge appears in finance operations, customer service, sales reporting, logistics, marketing analytics, and machine-learning models. Extreme values can shift averages, exaggerate variability, distort fitted relationships, and change alerts. Yet some apparent extremes are normal for the relevant segment: festive-season sales in India may look unusual compared with an ordinary week, and enterprise account purchases may be large compared with consumer orders. Good outlier detection therefore combines statistics, business context, and data-quality review rather than relying on one rigid numerical cutoff.
This guide explains how to identify outliers using the interquartile range (IQR), box plots, z-scores, time-series comparisons, and suitable anomaly-detection models. It shows how to calculate a simple example, document decisions, compare internal versus specialist support, and verify that a cleaned dataset still answers the right question. For teams creating repeatable dashboards or monitoring workflows, Rudrriv data analytics support can help define the measurements, exception-handling rules, and handover requirements without replacing the judgment of the people who own the business process.
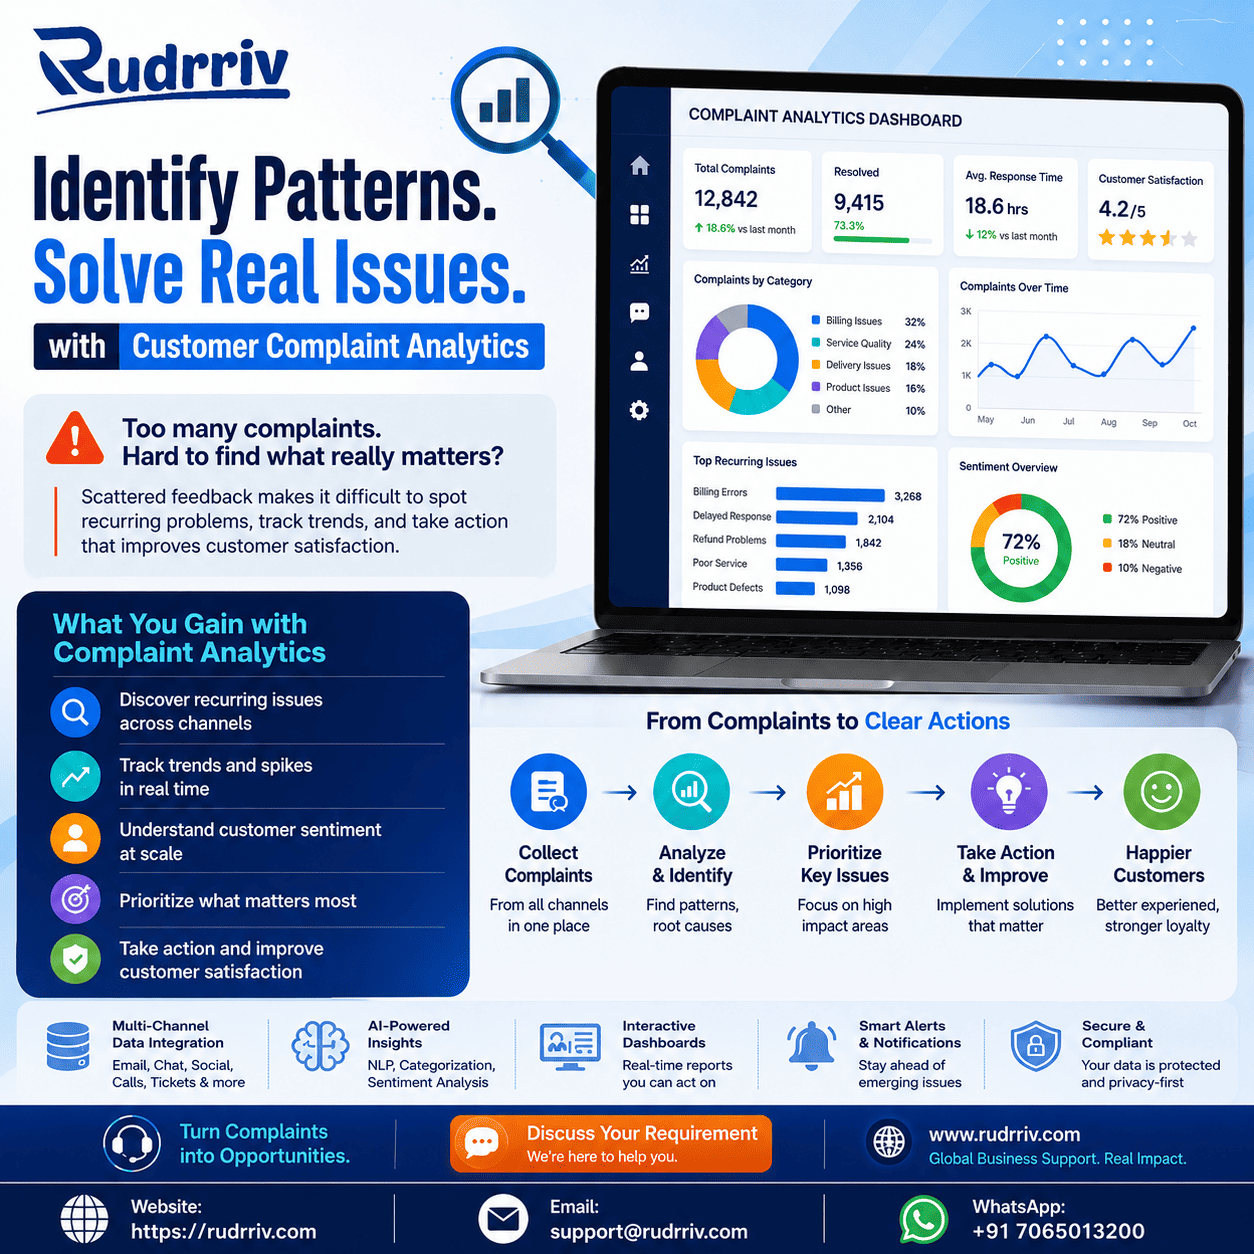
Quick Answer: What Is an Outlier?
An outlier is an observation that lies unusually far from the bulk of comparable observations. You can flag candidates with a box plot and IQR fences, a z-score for approximately symmetric data, a robust median-based method, or a time-series baseline. A statistical flag identifies something worth checking; it does not decide whether that observation is valid.
The safest first action is to validate the record. Check units, source-system values, duplicates, timestamp alignment, the population being compared, and known events. Then mark the value as confirmed, corrected, excluded with justification, or still under review. Keep both the original value and the decision history where possible.
For example, if a month-end invoice is ten times larger than other invoices, compare it with the contract, purchase order, and billing schedule. It may be an intentional annual renewal rather than an error. A good dashboard makes such decisions visible instead of silently dropping rows.
Key Takeaways
- Unusual does not mean incorrect: an outlier can be a valid, important business event.
- Start with comparable groups: compare like-for-like products, time periods, regions, or customer segments.
- Use the IQR rule for a simple first screen: values below Q1 − 1.5 × IQR or above Q3 + 1.5 × IQR are candidates.
- A z-score relies on mean and standard deviation: use caution with skewed data or multiple extreme points.
- Check root causes before removal: confirm source data, units, timing, and process events.
- Protect decisions: record the flag, reviewer, evidence, treatment, and effect on KPIs.
- Escalate recurring patterns: unusual values that repeat may indicate a changed process or a new baseline.
What This Page Covers
- What outliers mean and why they matter for business dashboards and customer intelligence.
- When a suspicious value deserves an investigation instead of automatic filtering.
- The main detection methods, including IQR, z-score, robust comparisons, and time-series models.
- A worked calculation with quartiles, fences, mean, and median.
- A repeatable investigation and documentation workflow.
- Internal, freelance, and managed-team approaches to data-quality monitoring.
- Practical business examples, a final checklist, and ten detailed FAQs.
Table of Contents
- How the guidance is grounded
- What counts as an outlier
- When businesses should investigate
- Detection approaches and delivery models
- Step-by-step investigation process
- In-house vs specialist vs managed team
- Scope, timing and effort
- Measuring data-quality impact
- Common outlier mistakes
- Outlier investigation checklist
How this guidance is grounded
This article draws on statistical practice and applied delivery controls. The NIST Engineering Statistics Handbook explains why unusual values require investigation and why deletion is not always appropriate. The NIST box-plot guidance describes IQR fences. For model-based screening, scikit-learn’s outlier-detection documentation distinguishes existing-data outliers from novelty detection.
Statistics establishes which values are unusual under stated assumptions; business validation determines what those values mean. Quartile conventions, reporting systems, software versions, and appropriate alert thresholds may differ. Teams should test their rules against representative historical records, review false alarms, and document any decision that alters a source metric.
What Is an Outlier in Data Analytics?
An outlier is a relatively extreme observation when compared with a defined reference group. The phrase “reference group” matters: a ₹2 lakh invoice may be exceptional among small retail orders but routine for a business-to-business software contract. If customer groups, currencies, units, or seasonal patterns are mixed, a perfectly correct observation can appear abnormal.
A univariate outlier is unusual in one variable, such as unusually high call-handling time. A multivariate outlier may look ordinary in each variable separately but strange in combination, such as a very high refund for a low-value order. A contextual outlier depends on conditions: a midnight support spike may be normal during a launch and unexpected on a quiet weekday. A collective anomaly can be a sequence of moderately unusual observations that becomes significant as a group.
Outlier and anomaly are often used interchangeably in business conversation. In technical work, the distinction may be narrower: an outlier is typically a distant individual observation, while anomaly detection may also cover unexpected patterns over time. The common decision rule is simple: flag → verify → explain → decide → document.
When Should a Business Investigate an Outlier?
Investigate when an unusual value could materially affect a decision, suggest a control failure, or reveal an important customer or operational event. Prioritize impact and plausibility rather than asking analysts to review every dot beyond a generic threshold. A valid high-value sale and an impossible negative transaction duration deserve different handling.
Common triggers for an exception review
- A customer-complaint count jumps sharply after a logistics change, product launch, or holiday promotion.
- A reporting KPI changes because of one unusual transaction, return, customer, or territory.
- A service-level metric records impossible durations, duplicate IDs, or mixed currencies.
- An advertising campaign shows unusually high conversions but weak source-system reconciliation.
- A fraud or risk-monitoring rule flags activity inconsistent with a customer’s normal behaviour.
- An AI or forecasting model produces unstable predictions after a new input-data feed.
Use severity tiers. A suspicious record that could affect a customer payment or regulatory return should receive faster review than a small deviation in an exploratory chart. At the same time, avoid equating an alert with misconduct: the purpose is to direct attention to facts, not assign blame.
Outlier Detection Methods and Support Models
No single method detects every meaningful anomaly. Choose a first-pass rule according to data shape, sample size, business context, and how decisions will use the result. The table separates common statistical approaches from the governance questions needed to put them into production.
| Method | Best used for | What it flags | Important check |
|---|---|---|---|
| IQR / box plot | Small or medium batches; skewed values | Points beyond Q1 − 1.5 × IQR or Q3 + 1.5 × IQR | Quartile method and subgroup definition |
| Z-score | Roughly symmetric, stable numeric data | Large distance from mean in standard-deviation units | Mean and spread can be distorted by extremes |
| Median and MAD | Skewed data or contamination-resistant screening | Large deviations from the median | MAD may be zero for highly repeated values |
| Time-series baseline | Daily volumes, demand, service levels | Values unusual for their trend and season | Holidays, missing dates, changing process |
| Isolation Forest / LOF | Larger multivariate datasets | Unusual feature combinations or local density | Features, false alarms, model governance |
Model selection note: box plots and simple thresholds often provide enough value for a first dashboard. Machine-learning detectors can support complex patterns, but they still need validation labels, appropriate training data, clear owners, and an escalation process.
In Excel, an analyst may start with QUARTILE.INC and conditional formatting; in SQL, a team may calculate percentiles by segment; in Python, an analyst may compare exploratory box plots with robust or model-based methods. For monitored Power BI time series, Microsoft’s anomaly detection guidance describes feature capabilities and limitations. The best tool is the one the business can verify and maintain.
Step-by-Step: Detect, Investigate and Resolve an Outlier
A reliable workflow treats detection and disposition as separate activities. The following ten steps work for one-off analysis as well as repeated monitoring of complaints, orders, invoices, operations, or customer experience.
Step 1: Define the business question
Specify whether the analysis supports forecasting, fraud review, dashboard reporting, customer support planning, or data cleansing. Write down what happens when a record is flagged. A staffing decision needs different rules from an accounting-reconciliation alert.
Step 2: Verify the population and units
Check currency, date grain, channel, region, customer type, and aggregation. Compare daily complaint counts with daily counts, not per-agent complaints or individual complaint records. Keep a simple data dictionary identifying each field and denominator.
Step 3: Profile missing and impossible values
Identify nulls, duplicates, broken timestamps, negative durations, inconsistent currencies, and changes in source fields before searching for statistical extremes. These are often data-quality faults with deterministic correction rules.
Step 4: Review the distribution visually
Plot a histogram, box plot, scatter plot, or time series. Note skew, multiple groups, and spikes near month-end, weekends, festivals, or campaigns. One chart can reveal why a global threshold would be inappropriate.
Step 5: Calculate a transparent first-pass threshold
For a simple batch, compute Q1, Q3, IQR, and the lower and upper fences. If the data are suitable, check z-scores too. State the quartile convention and do not turn “outside the fence” into “delete automatically.”
Step 6: Reproduce the flagged record
Trace the observation from dashboard to transformation, aggregation, and original source. Check raw transaction IDs, complaint tickets, source timestamps, join logic, and whether late-arriving events inflated or deflated the number.
Step 7: Ask the business owner for context
Determine whether a promotion, outage, customer incident, unusually large contract, or reporting calendar explains the value. Preserve evidence and record uncertainty where the owner cannot confirm an explanation.
Step 8: Choose a documented treatment
Possible outcomes include retaining a valid observation, correcting a verified entry error, splitting the data into better comparison groups, using a robust metric, or excluding a record for a clearly stated analytic purpose. Never overwrite source records without an authorized correction process.
Step 9: Compare results before and after
Recalculate mean, median, totals, rate denominators, model forecasts, and affected KPIs before publishing. Report if a proposed treatment changes the business interpretation. For repeatable models, test how thresholds behave out of sample.
Step 10: Assign ownership and monitor recurrence
Name the steward or decision owner, store the rule version and review history, and revisit alert precision after operational changes. A flagged value that recurs may describe a new normal rather than repeated exceptional behaviour.
How to Calculate an Outlier Using the IQR Rule
For a straightforward example, take the sorted daily complaint counts 10, 12, 13, 14, 16, 17, 18, 55. Using the median-of-halves quartile convention, Q1 is (12 + 13) ÷ 2 = 12.5 and Q3 is (17 + 18) ÷ 2 = 17.5. The interquartile range is Q3 − Q1 = 5. The lower fence is 12.5 − 1.5 × 5 = 5; the upper fence is 17.5 + 1.5 × 5 = 25. Because 55 is greater than 25, it is flagged for investigation.
The median is (14 + 16) ÷ 2 = 15, while the mean is 155 ÷ 8 = 19.375. The unusually high point pulls the mean upward, illustrating why an operations dashboard should sometimes show both measures. It does not prove the day was invalid. The 55 complaints might have come from a genuine outage and should remain visible in the incident record.
Quartile calculation conventions differ between applications, especially for small datasets. Agree on a definition before comparing results between Excel, Python, SQL, and a reporting platform. If an analyst uses a different convention, document the resulting thresholds and whether the flagged list changes.
Z-Scores, Robust Measures and Time-Series Context
A conventional z-score describes how many standard deviations an observation lies from the mean: z = (value − mean) ÷ standard deviation. Some teams use an absolute z-score above 3 as an initial screening convention for suitable approximately normal data, but that is not a universal business rule. For strongly skewed revenue, customer lifetime value, or invoice distributions, the normal assumption may be poor.
The median and median absolute deviation (MAD) can be more stable where a few extreme values influence the mean and standard deviation. Be careful when most observations are identical: MAD can be zero, requiring another rule. For daily complaints, web traffic, staffing, or sales, compare against day-of-week and seasonal patterns before declaring an operational exception. A Friday spike following a promotion is not comparable to a quiet Tuesday without adjustment.
In multivariable analysis, methods such as Isolation Forest or Local Outlier Factor can identify unusual combinations that single-variable fences miss. These methods produce candidate anomalies, not definitive business truth. Set a review budget, measure false positives, check drift, and avoid using sensitive customer attributes without a lawful and justified purpose.
In-House vs Freelancer vs Analytics Team: What Should You Choose?
Choose the support model based on recurrence, complexity, and accountability. A one-off Excel investigation may be handled in-house. A continuous anomaly-monitoring workflow that spans customer service, engineering, and leadership reporting may need several roles and clear service expectations.
| Option | Advantages | Limitations | Best fit |
|---|---|---|---|
| Internal analyst | Context, direct access, faster owner discussions | Limited capacity or specialist methodology experience | Occasional known metrics and simple quality checks |
| Independent specialist | Focused statistics, SQL or Python expertise | Continuity and operational cover may be limited | Defined diagnostic and rule-development project |
| Analytics service provider | Can combine data profiling, dashboards and technical delivery | Requires clear project ownership and acceptance criteria | New analytics workflow or reporting improvement |
| Managed data team | Continuity, QA, escalation, monitoring and documentation | Greater coordination and ongoing governance commitment | Recurring cross-system outlier monitoring |
Decision principle: the person who understands the operational meaning should approve the final disposition, even when an external team detects the value or builds the workflow. Outsourcing analysis should not mean outsourcing the business owner’s accountability.
What to Check Before Starting an Outlier-Detection Project
A usable project brief should identify the exact data source, business question, record grain, comparison groups, fields, expected delivery, reviewers, and what a flagged row triggers. Specify whether the provider can see personal data or only masked extracts, whether historical incidents are available for testing, and whether any fields are business-sensitive.
Agree on deliverables rather than broad phrases such as “AI anomaly solution.” Practical deliverables include a data-profile report, approved exception rules, a reproducible workbook or script, sample investigations, a flagged-record register, clear dashboards, access controls, an operating procedure, and handover documentation. The business should receive the ability to inspect thresholds and challenge an alert.
Document responsibilities for source access, data corrections, approvals, code maintenance, security, and dashboard publishing. If a specialist is engaged, confirm intellectual-property and usage rights for scripts and dashboards, version control, and knowledge transfer. These controls matter more than a polished detection demo.
Scope, Timing, Cost and Communication for Outlier Analysis
Effort depends on data quality, dataset volume, number of systems, alert complexity, review capacity, and frequency. A clean, one-table IQR analysis is very different from building a production monitoring pipeline across sales, complaints, logistics, and payments. Avoid fixed pricing estimates before confirming data access and the required quality checks.
What determines the scope?
List the sources and measures; choose whether the work is exploratory, scheduled, or real-time; document thresholds; and define review frequency. Include requirements for dashboard access, user permissions, escalation, record retention, and change history. If seasonality matters, allow enough representative historical data for an appropriate baseline.
How should proposals be compared?
Ask each provider to explain the same example record: what it would flag, how it would validate the event, who would approve a change, how false alarms would be assessed, and how an analyst would reproduce the result. Compare practical testing, documentation, implementation effort, and ongoing support—not just model sophistication or dashboard appearance.
What communication cadence works?
For a short project, use a discovery meeting, data-access checkpoint, prototype review, and acceptance sign-off. For an ongoing process, agree on daily or weekly exception queues, defined severity escalation, periodic threshold reviews, and monthly quality summaries. Make sure any provider or internal specialist can explain findings in plain business language.
How to Verify Findings, Corrections and Handover
Every flagged value should have a traceable path from input to decision. A simple exception register can capture observation ID, source, metric, time, comparison group, method, threshold, business impact, analyst, evidence, reviewer, decision, and closure date. Keep the raw observation separate from any analytical adjustment; changing a source table may alter multiple downstream reports.
Test with both real historical incidents and ordinary events that should not alert. Include known holidays, promotions, process migrations, refunds, and system outages. Recompute totals and denominators after any handling rule, verify that dashboards reflect the approved dataset, and test that new records follow the same process.
For handover, retain readable code or formulas, parameter definitions, a data dictionary, a reproducible sample, alert owner, escalation contacts, and instructions for reviewing false positives. An external specialist should demonstrate the workflow with your team before the engagement is marked complete.
How to Measure Detection Quality and Business Impact
Measure whether outlier monitoring produces better decisions, not only how many values it flags. High alert counts may reflect an unstable process, overly sensitive rules, or both. Review outcomes with the people who know the operation and separate data-quality improvement from commercial impact.
Detection and validation measures
- Flagged records as a share of reviewed records, segmented by rule and business unit.
- Confirmed data errors versus valid but unusual events.
- False-positive proportion among reviewed alerts and missed known incidents where test labels exist.
- Average time from flag to review, and from review to approved closure.
- Percentage of material exceptions with owner, evidence, outcome and reason.
Reporting and model stability measures
- Change in mean, median, total and rate denominators after approved treatments.
- Forecast or model performance on held-out data, including extreme-value periods.
- Frequency of threshold changes, source schema changes and recurring anomalies.
- Reproducibility of an alert when the same input and rule version are rerun.
Operational business measures
- Complaint resolution and repeat-contact patterns following genuine service incidents.
- Refund, transaction or delivery exceptions addressed after validation.
- Dashboard decisions improved by showing the value together with its context.
- Reduced manual rework only when independently measured against a baseline.
Do not claim that detecting more anomalies automatically increases revenue or lowers risk. Record tangible actions: a duplicate source feed corrected, a legitimate seasonal spike explained, or a misleading average replaced with a more useful segmented measure.
Common Outlier Detection Mistakes and How to Avoid Them
- Automatically deleting flagged records. Require documented evidence before exclusion; valid rare events often matter most.
- Comparing unlike populations. Segment enterprise versus consumer accounts, regions, channels, and seasonal periods.
- Using one cutoff everywhere. Review distribution, sample size, base rate, severity, and operational tolerance.
- Assuming an AI alert is a fact. Test on labelled incidents, review false alarms, and retain human approval for important actions.
- Ignoring aggregation errors. Check joins, duplicate events, filters and denominators before adjusting an observed KPI.
- Reporting only the mean. Display median, spread and sample count when skew or large events could mislead.
- Failing to preserve the original. Keep a raw record, an analysis-ready treatment and a clear audit note.
- Forgetting process changes. Reassess baselines after new products, campaigns, pricing or business operations.
Three Practical Business Examples of Outlier Decisions
Example 1: A complaint spike after a delivery change
An illustrative Indian ecommerce support desk normally receives 5–12 complaints per day, then sees 43 on one Saturday. The wrong shortcut is to delete the spike as “abnormal” before presenting a weekly report. Instead, the analyst checks order volumes, delivery partners, ticket timestamps, duplicate submissions and complaint categories. If a genuine fulfilment issue drove the increase, retain the count, tag the incident, and report complaints per 1,000 orders as well as absolute complaints. Specialist support can help create the drill-down dashboard and review trail; operational leaders still own the response.
Example 2: An unusually large enterprise invoice
A finance-operations report flags a ₹5,00,000 invoice among many ₹50,000 invoices. The common mistake is to treat all high values as data-entry errors and cap them at an arbitrary threshold. A better workflow checks the order, currency, billing interval and customer segment. If this is a legitimate annual enterprise contract, keep the amount in financial totals while using segmented analysis or robust charts for typical invoice size. An analyst can document why the record is included and how it affects averages.
Example 3: Website conversions rise during a festival campaign
A marketing dashboard shows a sharp conversion lift during a festival promotion. One team may assume a tracking failure; another may treat the uplift as the new monthly baseline. The right approach reconciles conversions with order records, checks tag deployment and attribution, compares the same campaign period across channels, and labels the event in the time series. If the lift is confirmed, it is valuable business evidence but may not forecast an ordinary week. A data specialist can automate event annotations and post-campaign analysis.
Outlier Investigation Checklist
- Write the decision that the analysis is expected to support.
- Confirm source, timestamp, data grain, units, currencies, and comparison segments.
- Profile nulls, duplicates, impossible values, and mapping errors.
- Examine distributions and relevant historical or seasonal comparisons.
- Select and document a detection rule with its assumptions.
- Identify who reviews severe or customer-impacting exceptions.
- Trace candidate outliers back to original records and business events.
- Record retain, correct, segment, exclude, or investigate decisions with reasons.
- Recalculate affected KPIs and verify dashboard/model outputs.
- Preserve raw data, approved logic, QA tests, access controls, and handover material.
How Rudrriv Can Help with Outlier Analysis
Rudrriv can support defined data-quality and analytics projects that start with the decision you need to make, not with a preselected algorithm. Relevant work may include data profiling, SQL or Python analysis, KPI definitions, customer-complaint dashboards, anomaly-monitoring prototypes, documented QA, and knowledge transfer. Explore data analytics and dashboard services for a suitable scope.
When a project genuinely requires machine-learning detection or integration, Rudrriv’s AI service options may support specialist discovery and implementation. An internal business owner should remain responsible for review thresholds, customer decisions, confidentiality, approvals, and acceptance. A manageable pilot with representative records and transparent evaluation is often preferable to deploying a complex detector before the business can interpret its alerts.
Summary: Outlier Meaning and Practical Next Steps
An outlier is a value that deserves additional attention because it differs from comparable observations. The best response is not always to remove it. Begin by defining the business question, checking data quality, selecting a transparent detection method, understanding the event, and recording a defensible decision. Keep valid rare events when they matter; correct verified errors through appropriate controls; and show how any treatment changes the reported result.
Simple exploratory work may be completed internally. Repeated monitoring across teams can justify a dedicated specialist or managed arrangement, with clear scope, milestones, permissions, quality reviews, ownership, and a tested handover. A good outlier process makes reports more trustworthy because it shows which exceptions were investigated and why the final metric can be relied on.
Frequently Asked Questions About Outliers
What is an outlier in simple terms?
An outlier is a value that is unusually different from the other comparable values in a dataset. If daily customer complaints are usually between 5 and 12, a count of 43 may be an outlier. It could be a true incident, an increase in order volume, a duplicated data feed, or a mistake in reporting. A screening method can flag 43, but only source records and business context can establish what happened. Start by identifying the relevant comparison group and verifying the observation before changing it. An outlier is not necessarily an error, fraud, or evidence of a failed process. A practical first check is to compare the same measure over several similar periods and inspect the rows that produced the number. When a value is valid, consider showing an annotation rather than hiding the event from decision-makers. Keep a record of the question asked, the result of the verification, and the person who accepted the explanation. This makes later reporting reviews easier.
How do you identify an outlier using the IQR method?
Calculate the first quartile (Q1) and third quartile (Q3), then subtract Q1 from Q3 to find the interquartile range, or IQR. The common box-plot fences are Q1 − 1.5 × IQR and Q3 + 1.5 × IQR. Values outside those fences are candidates for review. In the example 10, 12, 13, 14, 16, 17, 18, 55, the median-of-halves calculation gives Q1 = 12.5, Q3 = 17.5 and IQR = 5; the upper fence is 25, so 55 is flagged. Software can use different quartile conventions, especially with small datasets. Document the convention and investigate flagged records instead of deleting them automatically. This fence is a screening tool rather than a proof of incorrectness. For daily business data, consider separating weekdays and weekends or comparing within customer segments before applying the calculation. Keep the exact formula and software convention in the workbook or data pipeline. After a flagged value has been reviewed, show how retaining or excluding it changes the mean, median and overall interpretation.
What is the difference between an outlier and an anomaly?
An outlier usually describes an individual observation distant from most comparable observations. Anomaly is a wider term that can include unusual combinations, sequences, behaviours or time-series patterns. A single invoice much higher than peer invoices is a possible outlier; a series of slightly higher-than-usual refunds over several days may be an anomalous pattern even if no individual record crosses a basic IQR fence. In business projects, teams often use the terms interchangeably. The important distinction is what the detection method can observe and which decision follows an alert. Choose a method that matches your use case, then validate findings with source data and operational context. In practice, the model should match the business question. A box plot is often sufficient for explaining one unusual number to an executive audience. Detecting an evolving sequence of unusual customer behaviour may call for a time-series or multivariate method. Whichever terminology is used, define who receives an alert, what supporting evidence is displayed, and what decision is expected before the alert can be closed.
Should every outlier be removed from a dataset?
No. Removing every flagged value can bias averages, hide genuine incidents and make models perform poorly when rare events happen again. First classify the record. If it is a confirmed transcription or integration error, correct it using the authorized source process. If it is a valid large order, complaint spike or seasonal demand event, retain it for appropriate analyses. Sometimes a robust statistic, a separate segment or a clearly justified sensitivity analysis is better than removing the record. When an exclusion is necessary for a defined analytical purpose, keep the original data and document the rule, reason, reviewer and impact on results. For example, a genuine unusually large enterprise transaction should remain in revenue totals even if it is separated when describing a typical order. Conversely, a duplicated integration event should be corrected in a controlled manner so both operational reports and downstream analytics receive consistent data. Run a before-and-after sensitivity check, and make sure the treatment is approved for the particular decision rather than applied globally.
Is a z-score above 3 always an outlier?
No. An absolute z-score greater than 3 is a familiar screening convention when data are sufficiently close to a stable, symmetric distribution, but it is not a universal definition. Z-scores depend on the mean and standard deviation, both of which can shift when a dataset contains multiple extreme observations. Skewed order values, customer spending and complaint counts can produce misleading alerts under a simple normal-based rule. Inspect the distribution, business grouping and sample size before setting a cutoff. Compare with IQR, median-based measures or a relevant time-series baseline where appropriate. A z-score should inform a review rather than act as an automatic deletion policy. For reporting, show the raw observation alongside the mean, standard deviation, sample size and the chosen threshold. If there are many zeros, strong seasonality or an extremely long tail, choose a method that better reflects the underlying process. Evaluate whether the selected threshold creates an unmanageable number of false alarms. Statistical conventions should support investigation, not replace an explanation of why an event matters.
Can Excel, SQL, Python or Power BI detect outliers?
Yes. Excel can calculate quartiles, IQR fences and conditional formatting; SQL can compute segment-level distributions or percentile thresholds; Python can visualize data and apply statistical or machine-learning methods; and Power BI supports useful reporting visuals and time-series anomaly features in supported scenarios. The right choice depends on data volume, complexity, monitoring cadence and team skill. Begin with a clearly defined example and confirm that each tool produces the expected flagged rows. Check software documentation and version-specific support before promising a feature. Whatever tool is selected, retain reproducible definitions, test cases, data permissions and an accountable reviewer. An Excel prototype can be useful for aligning teams on definitions before transferring logic to an automated SQL or Python pipeline. In Power BI, ensure that the required visual and data-connection settings support the intended feature. Whatever platform is used, test a known normal event and a known abnormal event, record the resulting alerts and confirm that the responsible person can reproduce the calculation without proprietary guesswork.
How can a business distinguish a data error from a real outlier?
Trace the flagged observation to its original source and look for evidence. Check transaction IDs, customer tickets, event timestamps, currencies, units, duplicated records, transformations and whether the same value appears in upstream systems. Then ask the relevant business owner about promotions, outages, month-end activity, process changes or unusually large contracts. A negative delivery time may be a recording error, while a very large valid shipment may be an important event. Do not treat statistical distance as proof. Record the decision as confirmed error, validated event, unresolved, or another approved category; include evidence and how the reported KPI was affected. For instance, if complaints double, an analyst should check both the number of complaints and the number of orders; the absolute increase may coexist with an unchanged complaint rate. If a source correction is required, coordinate with the data steward rather than editing a published dashboard in isolation. Mark uncertain cases as open, assign an owner and review them again once additional evidence becomes available.
What should be measured in an outlier-monitoring dashboard?
Measure both the observations and the quality of the response. Useful views include flagged-record count and rate, severity, source and segment, validated errors, genuine incidents, unresolved cases, false positives among reviewed alerts, time to review, owner, disposition and change history. Business metrics may include complaint rates, delivery performance, refund values or conversion patterns depending on the use case. Provide drill-down access without exposing more personal or confidential information than users need. Review alert precision and repeated patterns regularly. A dashboard that merely highlights red dots without a way to verify and close them is not a complete monitoring process. Separate an alert’s statistical score from its business severity. One very large but valid sale may require a chart annotation, whereas a smaller transaction with missing authorization data may require immediate operational attention. Include dashboard filters for source, period and business owner so reviewers can inspect comparable records. Set a periodic review of alert rules to prevent a growing queue of low-value exceptions from obscuring important incidents.
Who owns the outlier decision when an external analyst is involved?
The organization’s designated data or business owner should approve materially consequential decisions. An external analyst may propose thresholds, build dashboards, examine source records and document recommended treatment, but the business owner understands contractual, operational and customer consequences. Before work starts, agree on the statement of work, permitted data access, review responsibilities, approval rules, use of scripts, intellectual-property rights, version history and handover. Have the provider demonstrate how an alert can be reproduced and challenged. For ongoing monitoring, define who handles weekends, urgent incidents, rule changes and unresolved alerts. A written operating procedure should distinguish detection, investigation, recommended action and final approval. The provider should not silently exclude records merely to improve model fit or reduce false-positive counts. Ask for an example issue log, test run, acceptance evidence and a complete handover to an authorized internal owner. Clarify the process for revoking external access at project completion and for supporting subsequent corrections.
When should a company hire specialist support for outlier analysis?
Specialist support becomes useful when unusual values recur, existing reports disagree, historical comparisons are complicated, or several systems need to be reconciled. It may also help when a team is choosing between robust statistical rules and more complex models, lacks capacity to implement monitoring, or needs auditable dashboards and documentation. Prepare a short brief describing the business question, data sources, example flags, review owners, decision impact and expected deliverables. A small fixed-scope investigation can be enough; continuous monitoring may justify a dedicated professional or managed team. Rudrriv can help explore an appropriately scoped data analytics engagement where relevant. A sensible first engagement can examine one business metric and a small, suitably representative set of records. Evaluate whether the work yields reproducible flags, understandable explanations and a workflow that internal owners can actually operate. Only then decide whether to expand across sources, departments or automated alerts. Request transparent assumptions, acceptance criteria, review checkpoints, implementation documentation and a defined exit or transition plan.
Need a Reliable Way to Investigate Outliers?
Share the business metric, data sources, sample exception, current tools, and reporting decisions that are affected. Rudrriv can help assess a focused analysis, a reproducible dashboard, or ongoing data-quality monitoring with clear ownership and acceptance criteria.
Discuss your data requirementAt Rudrriv, we make it easier for businesses to access the right expertise, execute important work, and scale with confidence.