
What Is Business Intelligence Reporting?
Business intelligence reporting is the process of converting business data into structured, repeatable reports that help people understand performance, investigate changes, and make informed decisions. It brings together data from relevant systems, applies agreed definitions and calculations, and presents the results through tables, charts, scorecards, and interactive views.
The important distinction is that BI reporting is not simply attractive visualization. A report is useful only when its numbers are trustworthy, its audience understands what they mean, and a decision or action follows. Before selecting software, a business should identify the questions it needs to answer, the people making those decisions, the source data required, and the consequences of an incorrect number.
For a small business, this may mean replacing a manually assembled weekly spreadsheet with one governed sales and cash-collection report. For an enterprise, it may involve a semantic model, data warehouse, role-based access, scheduled refreshes, certified metrics, and a portfolio of reports for executives and operating teams.
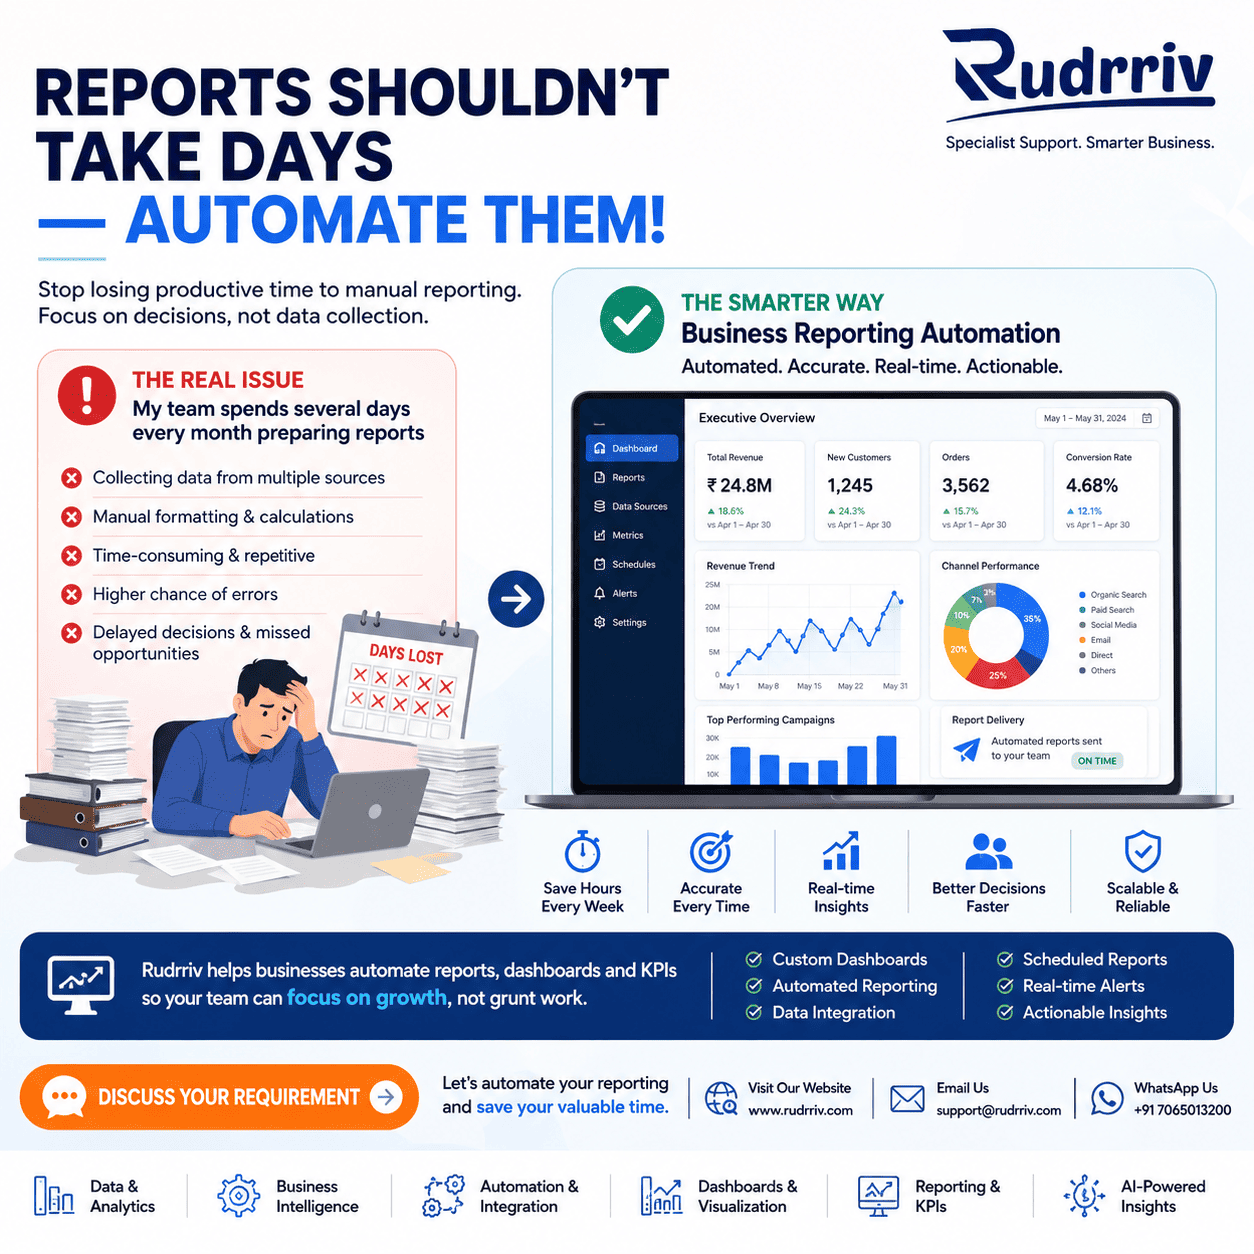
Quick Answer: What Is Business Intelligence Reporting?
BI reporting takes data from operational sources such as finance, sales, ecommerce, inventory, customer service, or product systems and turns it into consistent information for a defined audience. The output may be a recurring management report, a detailed interactive report, a scorecard, a regulatory pack, or an exception report that identifies where attention is needed.
A sound BI report answers a specific question, uses an approved metric definition, shows the relevant period and comparison, identifies the source and refresh time, and gives users enough context to interpret the result. Modern reports often allow filtering and drill-down, but interactivity does not compensate for weak data quality or unclear business logic.
Start with one decision area and a limited set of measures. Validate the numbers against source systems, assign owners for metrics and data quality, test access controls, and observe how users act on the report before expanding the reporting programme.
Key Takeaways
- BI reporting is decision infrastructure: it turns governed data into repeatable information for monitoring, diagnosis, and action.
- A report and a dashboard are not identical: dashboards emphasize concise monitoring, while reports usually provide deeper analysis and detail.
- Metric definitions matter more than visual polish: revenue, margin, active customer, conversion, and other measures must be calculated consistently.
- Refresh speed should match decision speed: real-time reporting is unnecessary when the business acts weekly or monthly.
- Small pilots reduce risk: begin with a high-value question, trusted sources, and a clearly defined audience.
- Governance keeps reporting reliable: ownership, access, testing, documentation, and change control must continue after launch.
- Success means action and trust: a report should reduce uncertainty, resolve recurring questions, and replace conflicting manual versions.
Table of Contents
- How BI reporting turns data into decisions
- What a business intelligence report contains
- BI reports, dashboards, and analytics compared
- When BI reporting becomes worthwhile
- How to implement BI reporting responsibly
- Practical BI reporting examples
- Cost, resources, and maintenance
- How to measure BI report quality
- Risks that make BI reports unreliable
- Summary
How BI reporting turns data into decisions
Business intelligence reporting links five elements: a business question, source data, defined logic, a reporting interface, and an operating response. If any element is missing, the result may be informative but not decision-ready.
The process normally begins with data from business applications. That data is extracted or connected, cleaned, reconciled, and organized for analysis. Calculations then convert records into measures such as revenue, units shipped, customer acquisition cost, order cycle time, service-level performance, or product adoption. The report presents those measures with comparisons, filters, and explanatory context.
IBM describes business intelligence as technological processes for collecting, managing, and analyzing organizational data to inform strategy and operations. The practical reporting layer is where many users experience that system: through reports, charts, maps, and dashboards that expose trends and exceptions.
Decision rule: do not begin by asking which BI tool to buy. Begin by asking which recurring decision is currently delayed, disputed, or based on incomplete information.
What a business intelligence report contains
A complete BI report contains more than charts. It should make the data understandable, traceable, and usable by its intended audience.
- Purpose and audience: the business question, decision owner, and expected use.
- Measures and dimensions: approved calculations and the ways results can be grouped, such as product, region, channel, customer segment, or time.
- Comparisons: target, budget, prior period, forecast, benchmark, or control limit.
- Context: definitions, exclusions, refresh time, source, caveats, and material changes.
- Interaction: filters, drill-down, drill-through, sorting, subscriptions, or exports where useful.
- Controls: role-based access, testing, ownership, certification, and change history.
Microsoft defines a Power BI report as a multiperspective view into a semantic model and notes that a report can contain one visual or many pages of visuals. It also distinguishes reports from dashboards by page count, filtering, data-model visibility, and customization. These distinctions are product-specific, but they illustrate a wider design principle: use a report when users need depth and exploration, and use a dashboard when they need concentrated monitoring.
BI reports, dashboards, and analytics compared
These terms overlap, but they serve different purposes. The table below provides a practical distinction rather than a rigid industry definition.
| Capability | BI report | Dashboard | Advanced analytics |
|---|---|---|---|
| Primary purpose | Explain performance and support detailed review | Monitor selected indicators and exceptions | Estimate, predict, optimize, or test scenarios |
| Typical depth | Multiple pages, filters, tables, and drill paths | Concise, often one-screen overview | Models, forecasts, experiments, or simulations |
| Main question | What happened, where, and why? | What needs attention now? | What may happen or what action is preferable? |
| Data requirement | Governed historical and current data | Trusted summary measures and thresholds | Suitable features, history, assumptions, and model validation |
| Best use | Operational, management, financial, and analytical review | Executive or team monitoring | Forecasting, risk, optimization, and decision science |
A dashboard can be the entry point to a report. For example, a red inventory indicator may alert a manager, while the linked report explains which products, warehouses, suppliers, or demand changes produced the exception. Advanced analytics becomes relevant only when the decision requires prediction, optimization, or causal investigation beyond descriptive reporting.
When BI reporting becomes worthwhile
BI reporting becomes worthwhile when recurring decisions depend on data that is fragmented, slow to assemble, disputed, or difficult to interpret. The strongest signals are operational rather than technological.
- Teams spend substantial time copying and reconciling data between spreadsheets.
- Different departments report different values for the same KPI.
- Leaders receive figures after the opportunity to act has passed.
- Users cannot move from a summary number to the underlying cause.
- Manual reporting creates errors, access risks, or key-person dependency.
- The business needs consistent views across products, locations, channels, or entities.
A small or early-stage company may not need a complex BI platform. Clean source systems, a controlled spreadsheet, and a small set of recurring reports can be sufficient while definitions and processes are still changing. BI investment becomes more compelling as data volume, reporting frequency, stakeholder count, and decision complexity increase.
How to implement BI reporting responsibly
Implementation should proceed from decision design to data validation, not from software features to a collection of visuals.
- Define the decision. State who will use the report, what question it answers, and what action may follow.
- Agree the metrics. Document formulas, inclusions, exclusions, time logic, currency rules, targets, and owners.
- Assess the sources. Check identifiers, completeness, history, latency, permissions, and reconciliation needs.
- Design the reporting model. Organize data and relationships so the same logic can support multiple views without duplication.
- Prototype with users. Test whether the report answers real questions, not merely whether charts render correctly.
- Validate and secure. Reconcile totals, test edge cases, apply role-based access, and confirm sensitive fields are protected.
- Launch with operating routines. Define refresh monitoring, issue handling, training, ownership, and review meetings.
- Improve through evidence. Remove unused content, refine confusing measures, and add new views only when they support a validated need.
Self-service can reduce reporting queues, but it requires governed datasets and clear boundaries. Users should be free to explore trusted data without creating competing definitions of core measures.
Practical BI reporting examples
Ecommerce: finding the cause of margin decline
An ecommerce company sees revenue growth but lower contribution margin. A sales dashboard alone may celebrate the growth. A better BI report joins orders, discounts, advertising spend, returns, shipping costs, and product costs. It allows managers to compare margin by channel, campaign, product, and customer cohort. The decision is not simply whether sales increased, but whether growth is economically healthy.
Professional services: balancing demand and capacity
A consulting firm prepares separate pipeline, staffing, and billing spreadsheets. The numbers arrive at different times and use inconsistent project stages. A governed BI report aligns opportunity probability, expected start date, available skills, utilization, and invoicing status. Leaders can identify likely capacity gaps without treating every unqualified lead as committed work.
Field operations: acting on service exceptions
A maintenance business needs to identify delayed jobs and repeat visits. A monthly summary is too slow. An operational BI report refreshes during the day and shows open jobs by age, location, technician, fault type, and parts dependency. Alerts are reserved for conditions that have a defined response, such as dispatch review or customer communication.
Cost, resources, and maintenance
BI reporting cost is driven less by the number of charts than by the condition of the data and the operating controls required. Licensing is only one component.
| Cost driver | Why it matters | Lower-complexity approach |
|---|---|---|
| Data sources | More systems create integration, reconciliation, and permission work | Start with one or two decision-critical sources |
| Metric complexity | Allocations, currencies, cohorts, and historical restatement require careful logic | Prioritize a small certified metric set |
| Refresh frequency | Frequent refresh can require stronger infrastructure and monitoring | Match refresh to the actual decision cycle |
| User and security model | Multiple roles, regions, or clients require row-level controls and testing | Launch with a clearly bounded audience |
| Change and support | Source changes, new definitions, and user requests continue after launch | Assign owners and a controlled backlog |
Typical responsibilities include a business owner, subject-matter expert, data or analytics specialist, report developer, source-system owner, and security or governance support. One person may cover several roles in a smaller company, but ownership must still be explicit. Maintenance includes refresh monitoring, source-change management, access reviews, data-quality checks, metric updates, performance tuning, user support, and documentation.
How to measure BI report quality
A BI report should be evaluated as both a data product and a business tool. Accuracy is essential, but a perfectly accurate report that users cannot understand or act upon still fails.
- Trust: users accept the figures and can trace important values to approved sources.
- Reliability: refreshes complete on schedule and failures are visible.
- Relevance: the report answers a recurring decision question.
- Usability: labels, filters, comparisons, and navigation are clear to the intended audience.
- Adoption: the correct users return to the report and reduce parallel manual reporting.
- Action: insights lead to defined reviews, investigations, or operational changes.
- Governance: permissions, definitions, ownership, and changes are controlled.
Track rejected or disputed figures, refresh incidents, unresolved data-quality issues, time spent producing reports, user questions, and decisions supported. These measures reveal whether the reporting system is becoming a trusted operating capability rather than another presentation layer.
Risks that make BI reports unreliable
The most damaging BI reporting mistakes occur before visualization. A chart can be technically correct while representing the wrong population, period, currency, status, or definition.
- Building before defining: teams create visuals without agreeing what the metric means.
- Automating poor data: faster refresh distributes errors faster.
- Duplicating business logic: each report calculates the same KPI differently.
- Using inappropriate precision: detailed numbers imply certainty that the source cannot support.
- Ignoring security: broad access exposes personal, financial, employee, or client information.
- Overloading the page: too many indicators hide the exceptions that matter.
- Confusing correlation with cause: reporting shows patterns but does not automatically prove why they occurred.
- Neglecting ownership: nobody is accountable when a source, definition, or business process changes.
The practical safeguard is a documented chain from source to measure to visual to decision. Every important report should have an owner, an approved definition set, a testing approach, and a clear process for correcting errors.
Summary
Business intelligence reporting converts governed business data into repeatable reports that support monitoring, investigation, and decisions. The right starting point is not a tool comparison. It is a specific business question, a defined audience, reliable source data, and agreement on what each measure means.
Use a dashboard for concise monitoring, a BI report for deeper analysis and exploration, and advanced analytics when the decision genuinely requires forecasting, optimization, or scenario modelling. Begin with a focused pilot, validate the numbers with users and source owners, then expand only when the reporting process is trusted and used.
Before scaling, confirm scope, budget, timeline, ownership, security, quality assurance, maintenance, documentation, and handover. Rudrriv can support businesses that need help defining BI requirements, preparing data, designing reports, validating metrics, or establishing an ongoing reporting capability.
FAQs About Business Intelligence Reporting
What is business intelligence reporting?
Business intelligence reporting is the structured process of turning data from business systems into governed reports, tables, charts, and interactive views that help people monitor performance, investigate changes, and make decisions. It combines data preparation, agreed metric definitions, analysis, visualization, distribution, and ongoing quality control.
How is BI reporting different from ordinary reporting?
Ordinary reporting may reproduce figures from one system or spreadsheet. BI reporting usually integrates multiple sources, applies consistent business definitions, supports filtering or drill-down, refreshes on a schedule, and provides governance around access, ownership, and data quality.
What is the difference between a BI report and a dashboard?
A BI report normally provides deeper, multi-page analysis with filters, detail, and explanatory context. A dashboard is usually a concise monitoring view that highlights selected indicators. A dashboard may help a manager notice a problem; the linked report should help investigate it.
What data is needed for business intelligence reporting?
Start with data that directly supports a business question. Common sources include ERP, CRM, ecommerce, finance, inventory, marketing, customer-service, product, and operational systems. The data must have usable identifiers, dates, definitions, permissions, and sufficient quality for the intended decision.
Which KPIs should a BI report include?
Include only metrics connected to an owner, target, timeframe, and action. A useful KPI should have a clear formula, approved source, business meaning, refresh frequency, and threshold. Avoid filling a report with measures that are interesting but do not change a decision.
How often should BI reports refresh?
Refresh frequency should match decision speed and source reliability. Executive and financial reports may refresh daily, weekly, or monthly, while operational reports may need hourly or near-real-time updates. Faster refresh adds cost and complexity, so it should be justified by a time-sensitive action.
How much does it cost to implement BI reporting?
Cost depends on the number and condition of data sources, integration work, licensing, security, metric complexity, report count, refresh needs, user volume, training, and maintenance. A small pilot based on clean existing data costs far less than an enterprise programme that requires a warehouse, governance, and multiple role-based reports.
Can a small business benefit from BI reporting?
Yes, when the business has recurring decisions that are slowed by manual spreadsheets or conflicting numbers. A small business should begin with a narrow report for a few high-value questions rather than building a large platform before its metrics, data ownership, and user needs are clear.
What are the main risks in BI reporting?
The main risks are inaccurate source data, inconsistent metric definitions, duplicated logic, excessive access, stale refreshes, misleading visuals, weak ownership, and low adoption. These risks are reduced through governance, testing, documentation, role-based security, user training, and regular review.
How do you know whether a BI report is successful?
A successful BI report is trusted, used, understood, and connected to action. Measure adoption, refresh reliability, data-quality incidents, time saved, decisions supported, questions resolved, and whether users stop maintaining parallel spreadsheets. Usage alone is not enough if the report does not improve a real process.
Need clearer business reporting?
Share the decisions you need to support, the systems holding the data, the reports currently produced, and the problems users face. Rudrriv can help define a focused BI reporting project, specialist support arrangement, or managed reporting workflow with clear ownership and controls.
Discuss your requirementAt Rudrriv, we make it easier for businesses to access the right expertise, execute important work, and scale with confidence.