
What Is a Business Intelligence Platform?
A business intelligence platform is a coordinated set of software capabilities that turns data from operational systems into governed metrics, dashboards, reports, alerts, and analysis that people can use to make decisions. It normally connects to multiple sources, prepares and models data, controls access, and gives users a consistent way to explore performance.
The practical decision is not whether a company would like better charts. It is whether recurring business questions are important enough—and the underlying data is mature enough—to justify a shared analytics environment. A BI platform can reduce manual consolidation and conflicting reports, but it will not repair unclear metric definitions, missing ownership, weak source data, or a decision process that ignores evidence.
Start with the decisions people need to make: which customers require attention, which products are profitable, where operations are delayed, how demand is changing, or whether a campaign is creating qualified outcomes. Then assess data availability, user roles, governance, security, cost, and implementation effort before choosing technology.
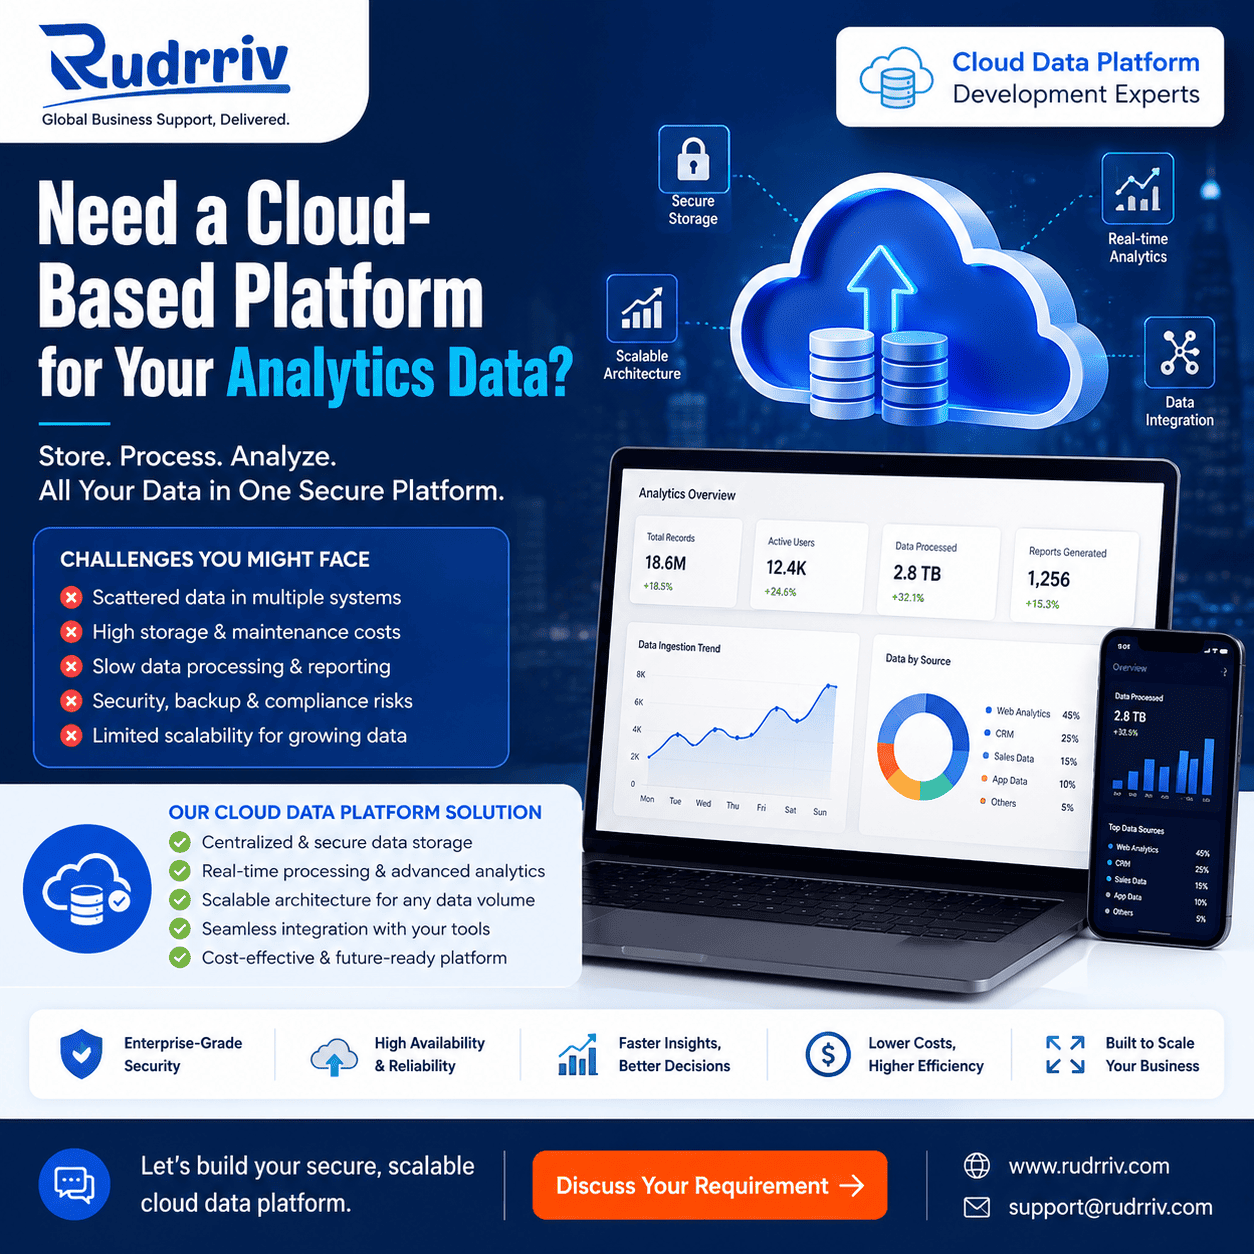
Quick Answer: What Is a Business Intelligence Platform?
A business intelligence platform combines data connectivity, transformation, semantic modelling, visualization, reporting, security, collaboration, and administration. It gives authorized users a trusted view of business performance and lets them move from a headline metric to the underlying drivers without rebuilding every analysis manually.
A company is likely to need one when several teams repeatedly combine data from different systems, definitions vary between reports, refreshes depend on manual work, access must be controlled, or decisions require faster investigation. A spreadsheet or basic reporting tool may remain sufficient when the data is small, stable, owned by one person, and used for limited decisions.
The strongest selection rule is to evaluate a BI platform against representative decisions, real data volumes, security roles, refresh patterns, and administration needs. Do not select solely from a vendor demonstration or a long feature list.
Key Takeaways
- BI is a decision system: dashboards matter only when they improve a defined business decision or workflow.
- Trusted definitions are essential: revenue, margin, customer, conversion, and other metrics need agreed logic and ownership.
- Architecture affects usability: source systems, pipelines, storage, semantic models, refresh frequency, and security determine what users can trust.
- Self-service needs boundaries: users need freedom to explore approved data without creating uncontrolled versions of key metrics.
- Total cost exceeds licence price: integration, modelling, governance, training, support, and maintenance are substantial cost drivers.
- A proof of concept should test risk: use representative data, permissions, calculations, performance, deployment, and administration.
- Adoption must be designed: place trusted insights inside meetings, operating reviews, alerts, and daily workflows.
Table of Contents
- What a BI platform includes
- When BI is the right investment
- BI platform architecture and data flow
- BI options compared
- Cost, resources, and operating model
- A practical BI implementation path
- Failure risks and safeguards
- How to evaluate a BI platform
What a BI Platform Includes
A BI platform is broader than a dashboard builder. Its components work together to make data usable, repeatable, secure, and understandable across teams.
Data connections and preparation
The platform may connect directly to databases, cloud applications, files, APIs, data warehouses, or lakehouse environments. Preparation capabilities clean, join, reshape, and validate data before it reaches users. Some organizations perform most transformation in a separate data pipeline; others use platform-native tools for lighter preparation.
Semantic models and governed metrics
A semantic layer translates technical tables into business concepts such as customer, product, order, region, margin, retention, and service level. Reusable calculations help ensure that two dashboards do not define the same KPI differently. This layer is often the difference between enterprise BI and a collection of disconnected visualizations.
Analysis, dashboards, and distribution
Users may consume scheduled reports, interactive dashboards, natural-language questions, mobile views, alerts, or embedded analytics inside another application. Analysts may explore data more deeply, while executives receive concise scorecards and operating teams receive exception lists linked to action.
Security, administration, and lifecycle control
Business intelligence platforms normally provide identity integration, role-based access, row-level or object-level security, audit logs, workspace controls, deployment processes, usage monitoring, and content certification. These controls become essential when financial, employee, customer, or commercially sensitive data is involved.
Decision rule: when comparing platforms, separate capabilities that create analysis from capabilities that keep analysis trustworthy at scale.
When BI Becomes the Right Investment
A BI platform is justified when the cost and risk of fragmented decision support exceed the cost of building a governed analytics capability. The following signals are more useful than company size alone:
- Recurring reports require manual exports, copying, and reconciliation.
- Leadership meetings spend time debating whose number is correct.
- Data is distributed across CRM, finance, ecommerce, marketing, support, and operations systems.
- Different users need different levels of access to the same information.
- Managers need to investigate causes rather than receive static totals.
- Reporting delays prevent timely operational action.
- Regulated or sensitive data needs stronger access and audit controls.
- Customer-facing software needs embedded reports or analytics.
A platform may be premature when source data is unavailable, the decision process is undefined, ownership is absent, or the business is still validating which metrics matter. In that situation, a narrow data discovery exercise and a small prototype can be more valuable than an enterprise purchase.
Three practical situations
A growing ecommerce business: teams manually combine storefront, advertising, fulfilment, returns, and finance data. The mistaken assumption is that a larger spreadsheet will solve the problem. A focused BI model covering contribution margin, inventory risk, repeat purchase, and fulfilment exceptions provides a better shared view, provided product and order identifiers are consistent.
A professional-services firm: partners receive monthly static reports but cannot examine utilization, pipeline, project margin, or overdue work by team and client. A lightweight BI layer connected to CRM, project, and finance systems may be enough. The firm does not need the most complex platform; it needs reliable definitions and permission-aware views.
An enterprise operations team: regional systems use different codes and service-level calculations. Buying visualization software first would reproduce inconsistency. The better decision is to define a governed data model, map regional variations, establish ownership, and then deploy dashboards and alerts over certified measures.
How BI Architecture Turns Data into Decisions
A platform works only when the path from source data to business action is clear. The architecture can be simple for a small team or highly distributed for an enterprise, but the control points remain similar.
The platform may include only some of these layers. For example, a cloud data warehouse may handle storage and transformation while the BI product handles semantic modelling and visualization. Evaluate ownership and interoperability between layers so that the organization is not locked into undocumented logic inside individual reports.
For practical background, review W3C data quality and data-use guidance and the NIST Privacy Framework when analytics involves sensitive information.
Compare BI Options by Operating Need
The market includes desktop analysis tools, cloud BI suites, embedded analytics products, open-source platforms, and analytics capabilities bundled with business applications. The useful comparison is not a brand popularity contest; it is a fit assessment against the organization’s operating needs.
| Decision dimension | Basic reporting or spreadsheets | Self-service BI platform | Enterprise governed BI | Embedded analytics |
|---|---|---|---|---|
| Best fit | Small, stable, local reporting | Departmental exploration and shared dashboards | Cross-functional, sensitive, or large-scale analytics | Analytics delivered inside a product or workflow |
| Data sources | Few files or exports | Multiple standard connectors | Complex warehouses, APIs, and governed domains | Application data and tenant-aware services |
| Metric control | Manual formulas | Reusable models with user flexibility | Certified semantic layers and lifecycle controls | Metrics designed for product users |
| Security | File or workspace permissions | Role and row-level controls | Identity, audit, segregation, governance, deployment | Application identity and tenant isolation |
| Administration | Low formal administration | Moderate workspace and model management | Dedicated platform, data, and governance roles | Product engineering and analytics administration |
| Primary risk | Manual error and version conflict | Uncontrolled self-service content | Complexity, cost, and slow adoption | Performance, security, and product integration |
A company can use more than one model. Enterprise-certified datasets can support centrally governed executive reporting while business teams create approved local analyses. Embedded analytics can use the same governed metrics for customers or partners.
Cost Depends on More Than BI Licences
Total cost should be modelled across acquisition, implementation, operation, and change. A low per-user price can be misleading if the platform requires expensive data engineering, premium capacity, specialist administration, or duplicate environments.
- Platform charges: named users, viewers, creators, capacity, compute, storage, data refresh, or embedded usage.
- Data foundation: connectors, extraction, transformation, warehouse or lakehouse costs, data quality, and monitoring.
- Implementation: discovery, architecture, modelling, dashboard design, testing, migration, documentation, and security review.
- People: data engineers, BI developers, analysts, data owners, administrators, trainers, and support.
- Ongoing change: new sources, metric changes, access requests, performance tuning, user support, and platform upgrades.
Estimate cost against a defined portfolio of decisions and users. A platform serving five executives has a different operating model from one supporting hundreds of analysts or embedding analytics for thousands of customers.
Resource needs also depend on governance. A small team may combine roles, but someone still needs authority over source access, metric definitions, release quality, security, and support.
Implement BI Through a Decision-Led Pilot
The safest implementation begins with a bounded decision domain rather than a company-wide dashboard catalogue. Choose a problem with identifiable users, accessible data, measurable reporting pain, and a decision that can change when better evidence is available.
- Define the decision: document who decides, how often, what alternatives exist, and which action follows each result.
- Inventory source data: confirm ownership, access, refresh frequency, historical depth, identifiers, and known quality gaps.
- Agree metric definitions: record formulas, filters, dimensions, exceptions, and accountable business owners.
- Design the user experience: match dashboards, alerts, drill paths, mobile access, and exports to real user behavior.
- Build and validate: reconcile totals to source systems, test edge cases, review permissions, and measure refresh performance.
- Run with real users: observe whether people find answers, understand definitions, and take action without analyst intervention.
- Establish operations: define support, ownership, release control, monitoring, documentation, and change requests.
- Expand selectively: reuse governed data and patterns only after the pilot is stable and valuable.
Useful adoption measures include active use by intended roles, reduction in manual report preparation, time to answer priority questions, metric reconciliation issues, support demand, decision cycle time, and evidence that insights are used in operating routines. Avoid treating dashboard views alone as proof of business value.
BI Failure Risks and Practical Safeguards
Most BI failures are not caused by chart formatting. They arise when technology is selected before the organization agrees on decisions, data, ownership, and operating responsibilities.
| Risk | What it causes | Practical safeguard |
|---|---|---|
| Dashboard-first implementation | Attractive outputs with weak decision relevance | Define users, decisions, actions, and acceptance criteria first |
| Conflicting metric logic | Teams debate numbers and lose trust | Create governed definitions, owners, and certified models |
| Unrestricted self-service | Duplicate datasets and uncontrolled sensitive data | Use approved data domains, permissions, training, and monitoring |
| Demo-driven vendor choice | Hidden integration, security, or scale limitations | Run a proof of concept with representative data and roles |
| Ignoring administration | Slow support, clutter, access risk, and fragile releases | Assign platform ownership, lifecycle rules, and support processes |
| No adoption plan | Teams return to spreadsheets and manual reports | Integrate BI into meetings, alerts, workflows, and role training |
Security and privacy should be tested early. Confirm identity integration, least-privilege access, row-level controls, export restrictions, auditability, data residency, retention, and incident processes. The NIST security and privacy controls provide a useful control reference for formal environments.
How to Evaluate a BI Platform
Use a weighted scorecard based on real requirements. Keep mandatory criteria separate from preferences, and require evidence for every score.
- Can it connect reliably to priority data sources and expected future sources?
- Can the organization create reusable, governed metric definitions?
- Does it support the required security model, including row-level access and audit logs?
- Can intended users understand and navigate it without excessive specialist support?
- Does performance remain acceptable with representative data volume and concurrency?
- Can content move safely between development, testing, and production environments?
- Are APIs, export formats, embedding, and interoperability sufficient to avoid unnecessary lock-in?
- Can administrators monitor usage, refresh failures, permissions, lineage, and content sprawl?
- Are licensing, capacity, infrastructure, support, and implementation costs predictable?
- Does the vendor’s roadmap and support model fit the organization’s operating horizon?
A proof of concept should use the same business scenario for each shortlisted option. Include at least one complex calculation, one security case, one refresh failure, one deployment change, and one performance test. The objective is to expose trade-offs, not to recreate a vendor’s ideal demonstration.
Where Specialist Support Adds Value
External support is useful when the organization needs independent requirements discovery, data architecture, semantic modelling, dashboard experience design, platform evaluation, implementation capacity, quality assurance, or ongoing administration. The support model should match the gap: a defined discovery project for an uncertain scope, specialists for focused delivery, or a managed team where data engineering, BI development, governance, and support must operate together.
Rudrriv can help businesses structure data and analytics requirements, access relevant specialists, and deliver defined or ongoing work through data and AI capabilities, development support, and experience design support. The appropriate starting point is a clear decision scope, representative data, and named owners—not a predetermined platform.
Summary: Choosing the Right BI Platform
A business intelligence platform connects operational data to governed metrics and usable analysis. It is most valuable when teams need repeatable answers across systems, shared definitions, controlled access, faster investigation, and a dependable way to move from insight to action.
Basic reports or spreadsheets can remain sufficient for small, stable, low-risk needs. Self-service BI fits teams that need exploration within governed boundaries. Enterprise BI becomes appropriate when security, semantic consistency, scale, lifecycle control, and cross-functional adoption matter. Embedded analytics is a separate choice when insights must appear inside a customer or employee application.
Before approving a platform, validate the decision use cases, source data, scope, budget, timeline, maintenance, ownership, quality assurance, and handover responsibilities. Select through a representative proof of concept and an operating model that covers governance, support, training, and continuous improvement.
FAQs About Business Intelligence Platforms
What is a business intelligence platform?
A business intelligence platform is software that connects to business data, prepares and models it, and presents trusted metrics through dashboards, reports, alerts, and analysis tools. Its value depends on governed definitions, reliable data pipelines, appropriate access controls, and adoption in real decisions—not simply on attractive charts.
How is a BI platform different from a reporting tool?
A reporting tool mainly produces predefined outputs from known data. A BI platform usually adds governed semantic models, interactive exploration, multiple data connections, reusable metrics, collaboration, administration, security, and deployment controls. The distinction matters when several teams need consistent answers rather than isolated reports.
When does a small business need a business intelligence platform?
A small business may need BI when recurring decisions depend on data spread across accounting, CRM, ecommerce, advertising, support, or operational systems and spreadsheet consolidation is slow or inconsistent. Start with a few high-value decisions and a limited data model rather than implementing an enterprise-wide platform immediately.
Can a business intelligence platform replace spreadsheets?
It can replace many recurring spreadsheet reports, especially where teams need refreshable data, shared definitions, permissions, and auditability. Spreadsheets can still remain useful for ad hoc calculations and local scenarios. The practical goal is to remove fragile manual reporting, not to prohibit every spreadsheet.
What data preparation is required before implementing BI?
You need identified source systems, data owners, quality rules, stable identifiers, agreed metric definitions, refresh requirements, and access controls. Data does not have to be perfect, but known gaps must be documented. A pilot should expose quality problems early rather than hiding them inside dashboard calculations.
How much does a business intelligence platform cost?
Cost includes licensing or cloud consumption, data integration, storage, modelling, implementation, training, governance, support, and ongoing enhancement. The cheapest licence can become expensive if it requires extensive engineering or specialist administration. Compare total operating cost against the decisions and manual work the platform will improve.
Should a company choose self-service BI or centrally managed BI?
Most organizations need a governed combination. Central teams should manage sensitive data, certified metrics, security, and shared models, while trained business users explore approved data within defined boundaries. Fully centralized reporting can create bottlenecks; completely unrestricted self-service can create conflicting numbers and uncontrolled data copies.
How long does BI implementation take?
A focused pilot can often be delivered faster than an enterprise programme, but timing depends on source access, data quality, security review, metric agreement, integration complexity, and user availability. Plan around a specific decision domain, test with real users, and expand only after the data and workflow are dependable.
What are the main risks of choosing the wrong BI platform?
Common risks include weak integration with core systems, uncontrolled metric duplication, poor performance at expected scale, licence costs that rise unexpectedly, inadequate row-level security, limited deployment controls, and low adoption. A proof of concept should test representative data, users, permissions, refresh patterns, and administration—not only a polished demo.
How should a business compare BI vendors?
Compare vendors using weighted requirements for data connectivity, semantic modelling, governance, security, usability, embedded analytics, performance, administration, deployment, support, and total cost. Use the same representative use cases and sample data for every vendor, document assumptions, and include technical and business users in evaluation.
Need Help Defining Your BI Requirement?
Share the decisions you need to improve, source systems, current reporting problems, user groups, security needs, and internal capacity. Rudrriv can help clarify requirements and structure a practical discovery, implementation, specialist-support, or managed-team engagement.
Discuss your requirementAt Rudrriv, we make it easier for businesses to access the right expertise, execute important work, and scale with confidence.