We are # 1 Top Best Modern Reliable Trusted Data Visualization Service
Our cutting-edge data visualization services combine advanced technology with expert consultancy to deliver customized, interactive dashboards and reports tailored to your needs.
#DataVisualizationServices #BusinessIntelligence #DataDrivenDecisions #DataAnalytics #InteractiveDashboards #CustomReporting #DataInsights #VisualizeYourData #BusinessGrowthTools #DataStorytelling
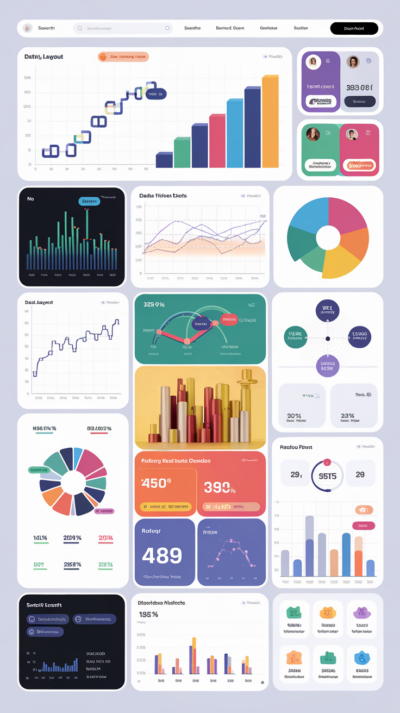
We provide Best & Affordable Data Visualization Service
Our expert team combines creativity, functionality, and cutting-edge technology to create stunning, professional websites tailored to showcase your unique talents—all at a price that fits your budget.
Unlock Insights with Expert Data Visualization
Transform your raw data into actionable insights. Click here to start your journey to smarter decision-making today!Our Step by Step to develop
Data Visualization Service
With a focus on creativity and precision, we guide you at every stage to create a portfolio website that truly reflects your vision and elevates your brand!
Visualize Your Success with Our Solutions
Simplify complex data with intuitive visuals. Contact us now to explore custom data visualization services!In today’s data-driven world, making sense of raw data is essential for businesses to remain competitive. At Rudrriv Solutions Pvt Ltd, our Data Visualization Services are designed to help organizations transform complex data sets into meaningful visual insights. By utilizing advanced tools and techniques, we empower businesses to identify trends, discover opportunities, and make informed decisions. Whether it’s for performance monitoring, predictive analytics, or strategic planning, our solutions are tailored to meet your unique needs and deliver measurable results.
- Custom Dashboard Development
- Design and build dashboards tailored to specific business needs.
- Provide real-time data updates for performance monitoring.
- Integrate with tools like Tableau, Power BI, and Google Data Studio.
- Interactive Data Visualization
- Create dynamic charts, graphs, and infographics.
- Enable drill-down capabilities and filters for deeper insights.
- Support for interactive maps and geographic data visualizations.
- Data Storytelling and Reporting
- Develop narrative-driven visualizations to communicate complex data effectively.
- Design engaging presentations and reports for stakeholders.
- Focus on aligning visuals with business strategies and KPIs.
- Predictive and Advanced Analytics Visualization
- Represent predictive analytics outcomes in clear, visual formats.
- Highlight trends, patterns, and projections for future decision-making.
- Support for machine learning and AI-generated data insights.
- Big Data Visualization
- Handle large and complex datasets with advanced visualization tools.
- Provide scalable solutions for big data analytics.
- Use cloud-based platforms for enhanced performance and accessibility.
- KPI and Performance Metrics Dashboards
- Create executive dashboards to track company performance in real-time.
- Include customizable metrics to align with organizational goals.
- Provide trend analysis and comparative visualizations for better planning.
- Real-Time Data Integration
- Integrate data from multiple sources into unified dashboards.
- Enable real-time monitoring for operational efficiency.
- Use APIs and connectors to sync with CRM, ERP, and other tools.
- Mobile-Friendly Data Visualizations
- Design responsive dashboards that work across all devices.
- Provide mobile-specific visualizations for on-the-go decision-making.
- Ensure seamless navigation and usability on smartphones and tablets.
- Cross-Platform Compatibility
- Ensure visualizations work seamlessly across different platforms.
- Support for desktop, web-based, and mobile applications.
- Utilize universal formats for compatibility with third-party tools.
- Customized Reporting Solutions
- Offer automated report generation for daily, weekly, or monthly updates.
- Include interactive elements in reports for enhanced engagement.
- Ensure consistent branding and layouts in all reports.
- Data Governance and Compliance
- Ensure all visualizations meet data security and governance standards.
- Provide solutions for sensitive data visualization with restricted access.
- Support compliance with GDPR, HIPAA, and other regulations.
- Industry-Specific Visualization Solutions
- Tailored services for industries like healthcare, finance, retail, and education.
- Address unique data challenges and visualization requirements of specific sectors.
- Develop visualizations that meet regulatory and operational standards.
- Training and Consultation
- Provide training sessions to help teams leverage data visualization tools.
- Offer expert consultation for designing and implementing visualization strategies.
- Conduct workshops on best practices for data visualization.
Each of these services is designed to empower businesses with actionable insights and help them make informed decisions using data visualization techniques.
- Custom Dashboards
- Develop interactive dashboards that provide real-time access to key metrics.
- Tailored designs to match your brand identity and business goals.
- Integrations with tools like Tableau, Power BI, and Google Data Studio for seamless usability.
- Interactive Data Charts and Graphs
- Transform raw data into visually engaging charts, graphs, and infographics.
- Dynamic visuals that allow for drilling down into specific data points.
- Clear and concise representations to simplify complex datasets.
- Data Storytelling
- Create compelling narratives around your data to communicate insights effectively.
- Visual presentations designed to engage stakeholders and drive actionable outcomes.
- Focus on aligning visuals with business strategies and goals.
- Performance Monitoring and Reporting
- Real-time tracking of KPIs and performance metrics across departments.
- Automated reporting systems for timely insights without manual effort.
- Custom templates and layouts for presenting data consistently and professionally.
- Cross-Platform Accessibility
- Cloud-based solutions that allow you to access visualizations from any device.
- Mobile-friendly designs for on-the-go decision-making.
- Compatibility with multiple platforms and operating systems for flexibility.
- Predictive and Advanced Analytics Visualization
- Represent predictive analytics and AI-driven insights in a clear, understandable format.
- Highlight future trends and scenarios for proactive decision-making.
- Support for big data analytics to handle large and complex datasets.
- Data Integration and Governance
- Consolidate data from various sources into unified visualizations.
- Ensure accuracy, consistency, and compliance in data representation.
- Enhance data governance processes through structured visualization frameworks.
- Industry-Specific Solutions
- Tailored visualizations for industries such as healthcare, finance, retail, and more.
- Address industry-specific challenges with focused insights.
- Develop sector-specific dashboards to meet regulatory and operational needs.
- Expert Consultation and Support
- Work with experienced data visualization specialists to design and implement solutions.
- Ongoing support and optimization to ensure your visualizations stay relevant and impactful.
- Training sessions for your team to make the most of the tools and solutions we provide.
By choosing Rudrriv Solutions Pvt Ltd, you gain access to innovative data visualization tools and services that bridge the gap between data and decision-making. Let us help you turn your data into a powerful business asset!
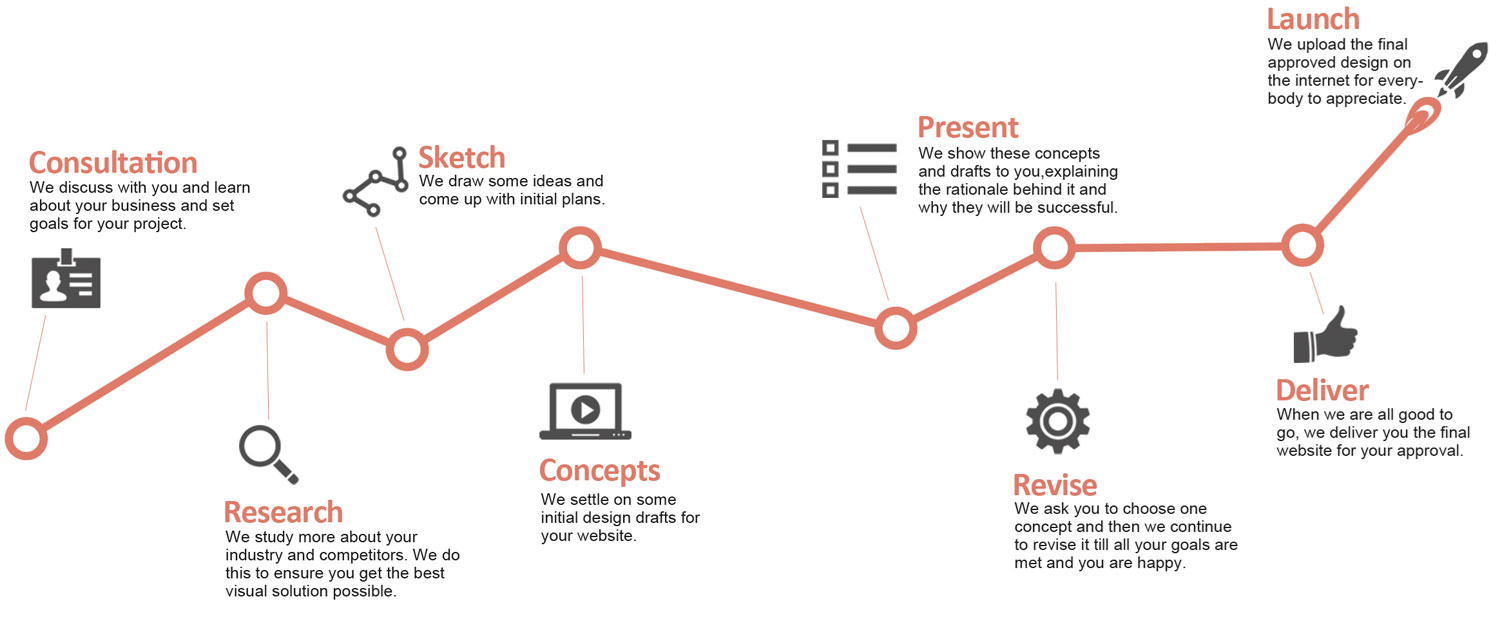
Our Data Visualization Services are designed to ensure a seamless journey from understanding your needs to delivering customized solutions that drive actionable insights. By leveraging an Agile methodology, we guarantee transparency, flexibility, and efficiency throughout the process.
1. Initial Consultation and Requirement Gathering
Features:
- Comprehensive consultation to understand your business goals and data challenges.
- Identification of key metrics, data sources, and visualization preferences.
- Detailed project scoping and timeline estimation.
Benefits:
- Clear understanding of project requirements from the outset.
- Customized solutions tailored to your unique needs.
- Minimized risk of scope creep with a defined roadmap.
2. Data Assessment and Integration
Features:
- Assessment of data quality, structure, and relevance.
- Integration of multiple data sources into a unified system.
- Ensuring compliance with data governance and security standards.
Benefits:
- Streamlined data flow for accurate and reliable visualizations.
- Reduced time and effort spent on manual data preparation.
- Enhanced data accuracy and consistency.
3. Design and Prototyping
Features:
- Development of wireframes and prototypes for initial visualization concepts.
- Collaborative sessions to gather client feedback and refine designs.
- Creation of visually engaging and user-friendly interfaces.
Benefits:
- Early-stage validation of design concepts.
- Opportunity for iterative feedback to ensure alignment with business goals.
- Faster time-to-market with a clear and focused design process.
4. Development and Implementation
Features:
- Building interactive dashboards, charts, and reports using advanced tools like Tableau, Power BI, or custom platforms.
- Incorporating features such as real-time updates, filters, and drill-down capabilities.
- Rigorous testing to ensure functionality, scalability, and user experience.
Benefits:
- Dynamic and responsive visualizations that adapt to your needs.
- Ability to explore data in depth with intuitive interaction features.
- Error-free deployment ensuring high performance and reliability.
5. User Training and Knowledge Transfer
Features:
- Hands-on training sessions for your team to navigate and utilize the visualizations.
- Comprehensive documentation and best practices for data visualization usage.
- Continuous support for onboarding and troubleshooting.
Benefits:
- Empowered teams capable of leveraging visualizations effectively.
- Reduced dependency on external support.
- Enhanced decision-making through better understanding of visual tools.
6. Ongoing Support and Optimization
Features:
- Regular updates to visualizations to align with evolving business needs.
- Performance monitoring and optimization for dashboards and reports.
- 24/7 support for any technical or functional issues.
Benefits:
- Future-proof visualizations that grow with your business.
- Assurance of optimal performance and accuracy over time.
- Peace of mind with dedicated support and proactive maintenance.
The Agile Phases We Follow:
- Planning Phase: Define goals, deliverables, and timelines.
- Design Phase: Create wireframes and gather feedback for alignment.
- Development Phase: Build and test the visualizations iteratively.
- Testing Phase: Conduct rigorous testing for quality assurance.
- Deployment Phase: Implement the solution and provide training.
- Maintenance Phase: Offer continuous support and optimization.
By following this detailed process, Rudrriv Solutions Pvt Ltd ensures that every step is executed with precision and collaboration, resulting in high-quality data visualization solutions that drive impactful business decisions.
At Rudrriv Solutions Pvt Ltd, our consultancy team comprises highly skilled professionals with extensive experience in data visualization and related domains. Our team brings a wealth of expertise, a commitment to excellence, and a proven track record of delivering impactful solutions to clients across industries. Below is an overview of our team’s qualifications and experience:
Turn Data Into Action with Stunning Dashboards
Discover trends and make informed decisions faster. Get in touch to design your custom data dashboards today!FAQs on Data Visualization Service
See Your Data Like Never Before
Experience cutting-edge data visualization services. Contact us now to create impactful visual solutions tailored to you!All About our Data Visualization Service
Empowering Digital Excellence
At Rudrriv, we are dedicated to delivering innovative, tailored solutions that drive growth, elevate brands, and transform businesses in the digital era.
Trusted by
15,000 Companies
See what people
 are talking!
Hear from our satisfied clients see what people are saying about their experience with us!
Recognized Excellence, Trusted by Leaders
Our achievements speak volumes—partnered with industry giants like Microsoft, Google, and AWS, and honored with accolades from Clutch, Upwork, and more, we are proud to deliver exceptional results that inspire trust and drive success for our clients worldwide.
